Improved
New Architecture on Execution Logs
March 13th, 2026
Starting from v11.4, Execution Logs have a brand new dedicated page in AI Lab with a significantly improved experience — richer information per entry, powerful filtering, and better performance.
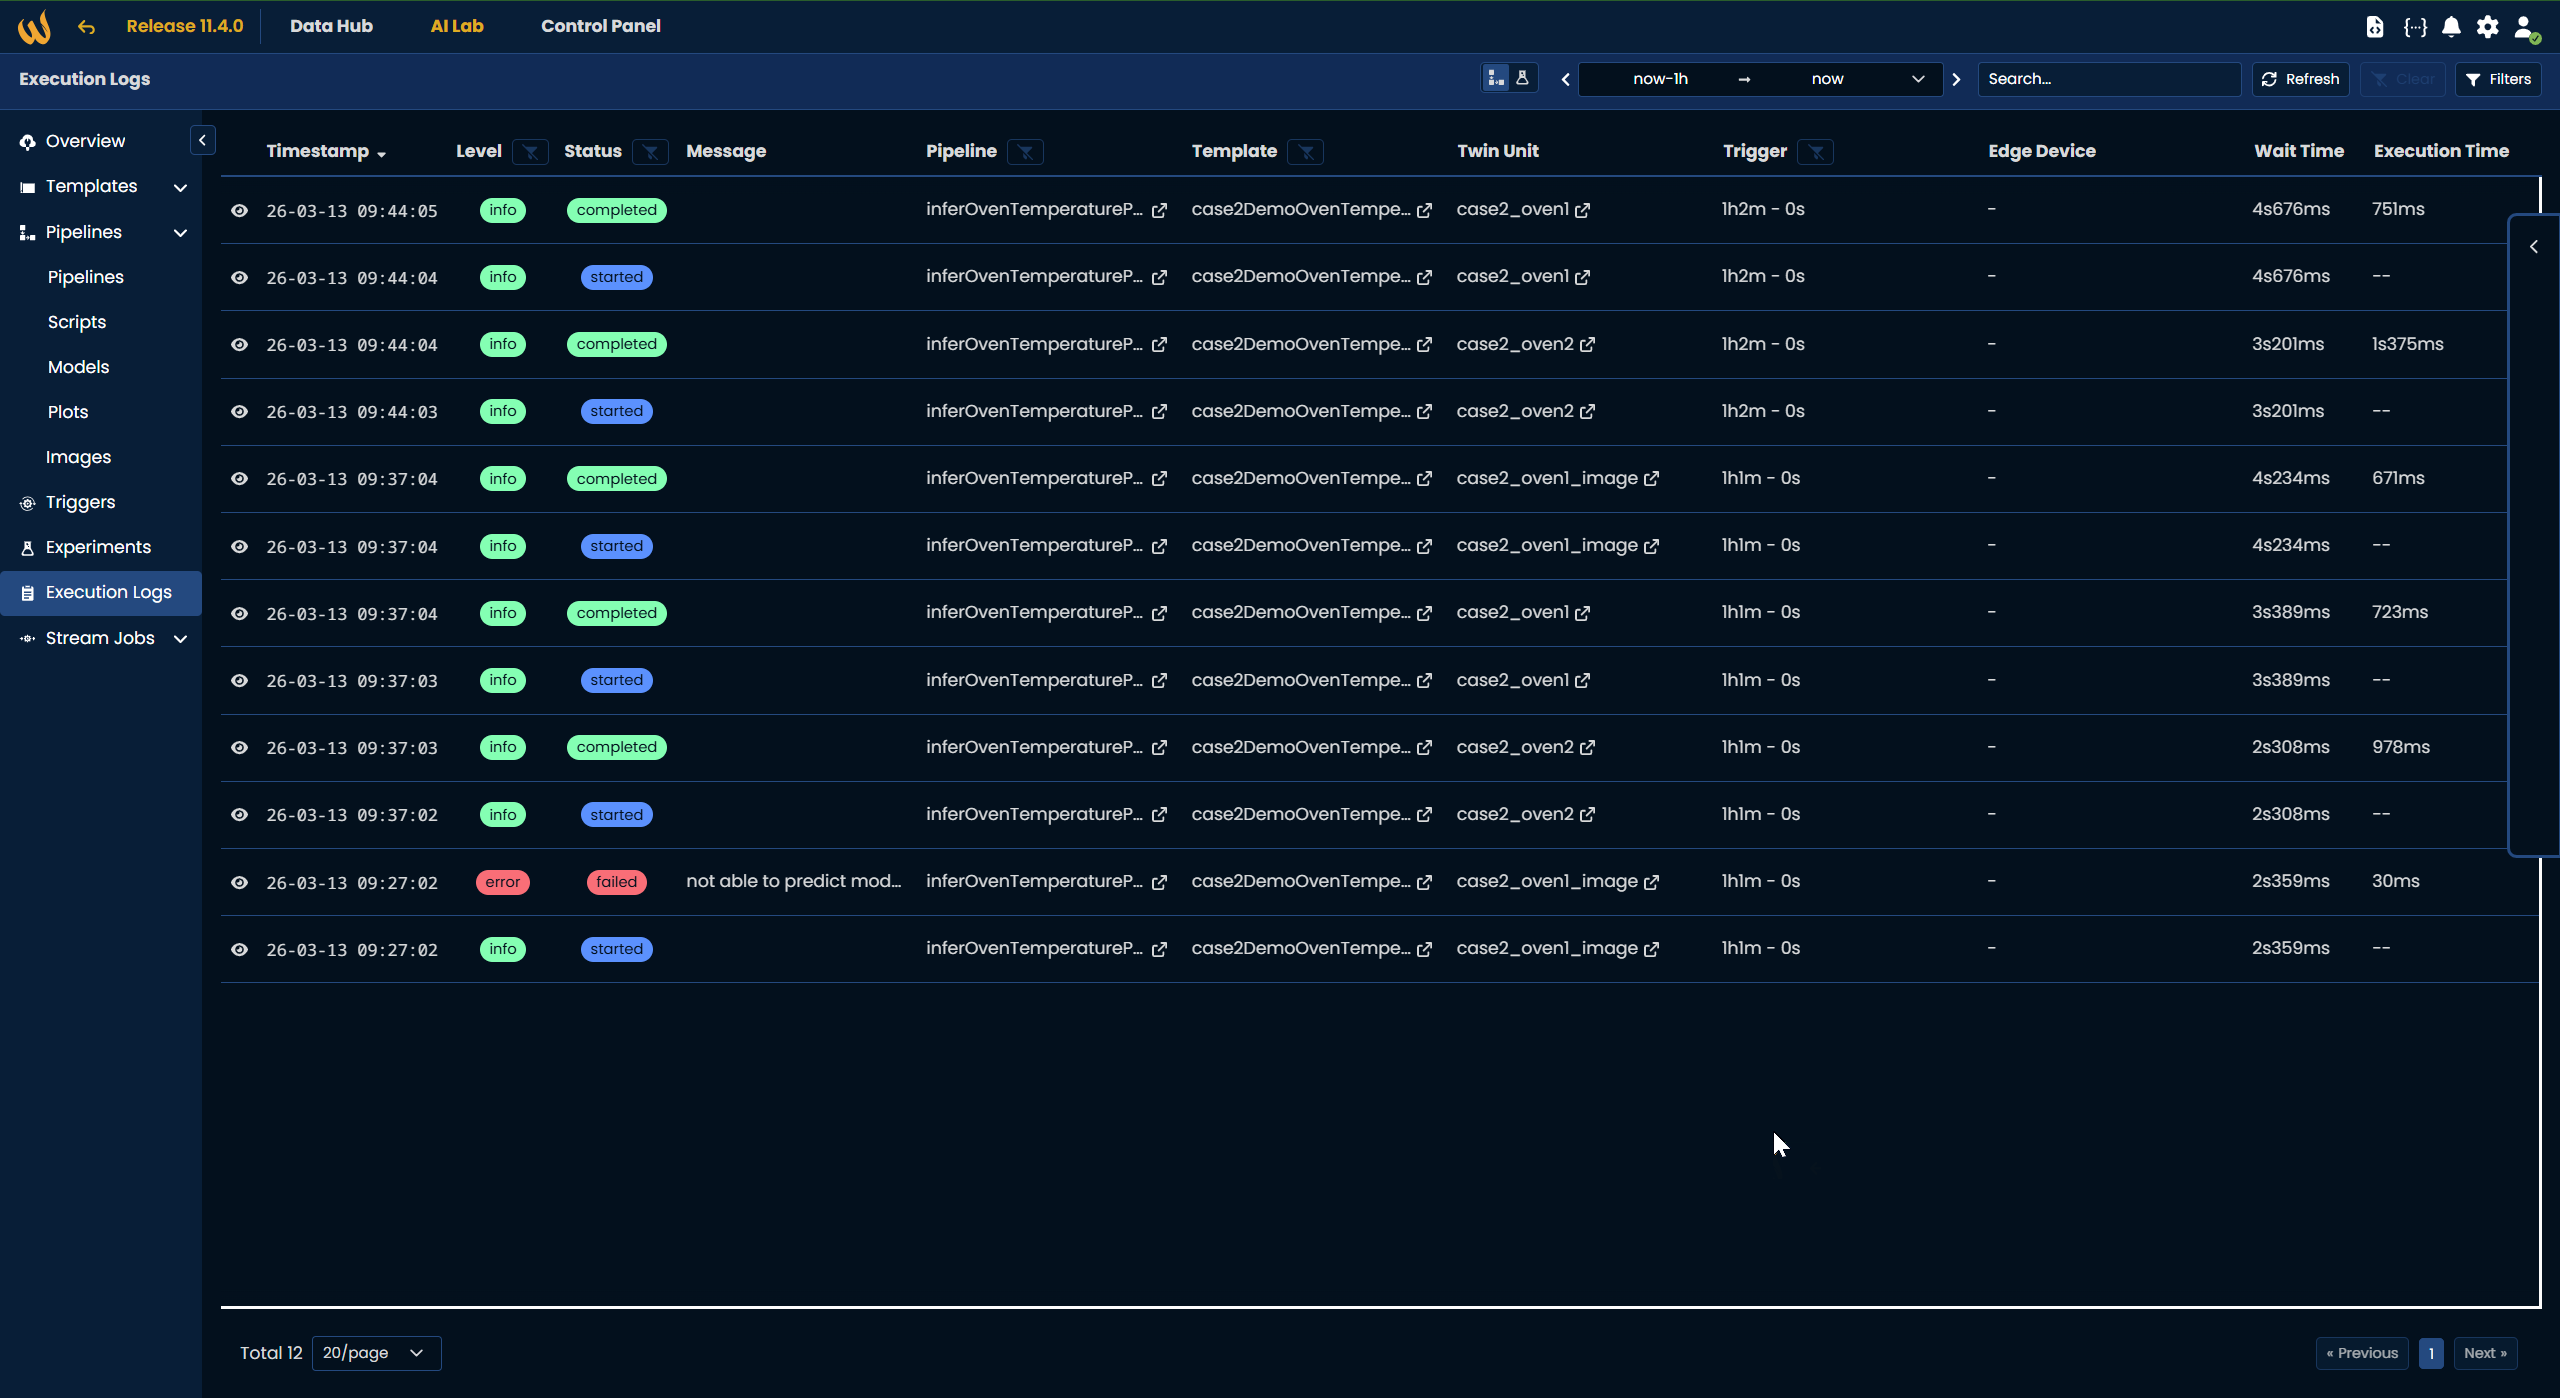
Each log entry now shows a precise timestamp, a color-coded level (info, warning, error), execution status, associated pipeline, template, twin unit, trigger, edge device, and both wait time and execution time.
- Filter by time range, status, pipeline, trigger, twin, edge device and more
- Full-text search across log messages
- Sortable columns and paginated results
- Execution logs from Edge devices are now synced to the cloud automatically, with efficient management of internet disruptions
For a full walkthrough of all available interactions, check our dedicated documentation: Execution.