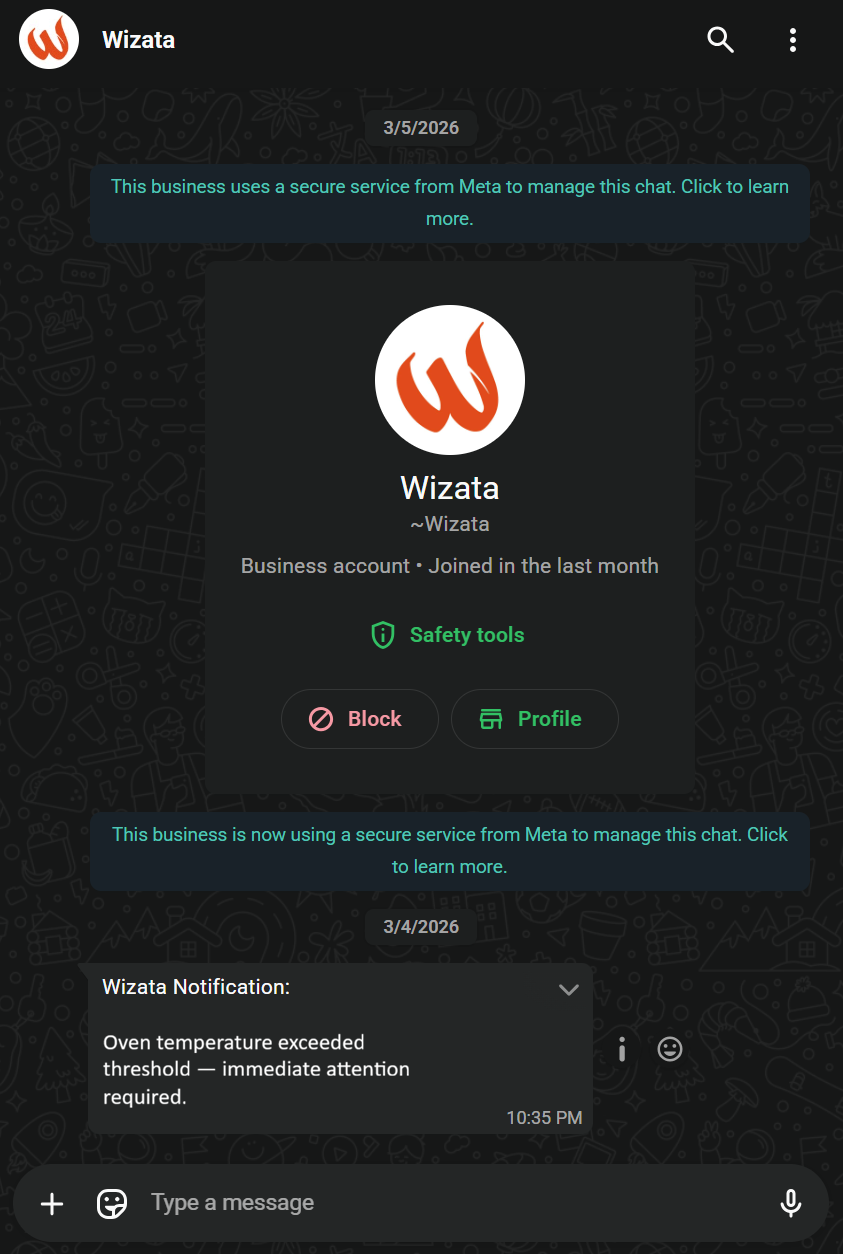
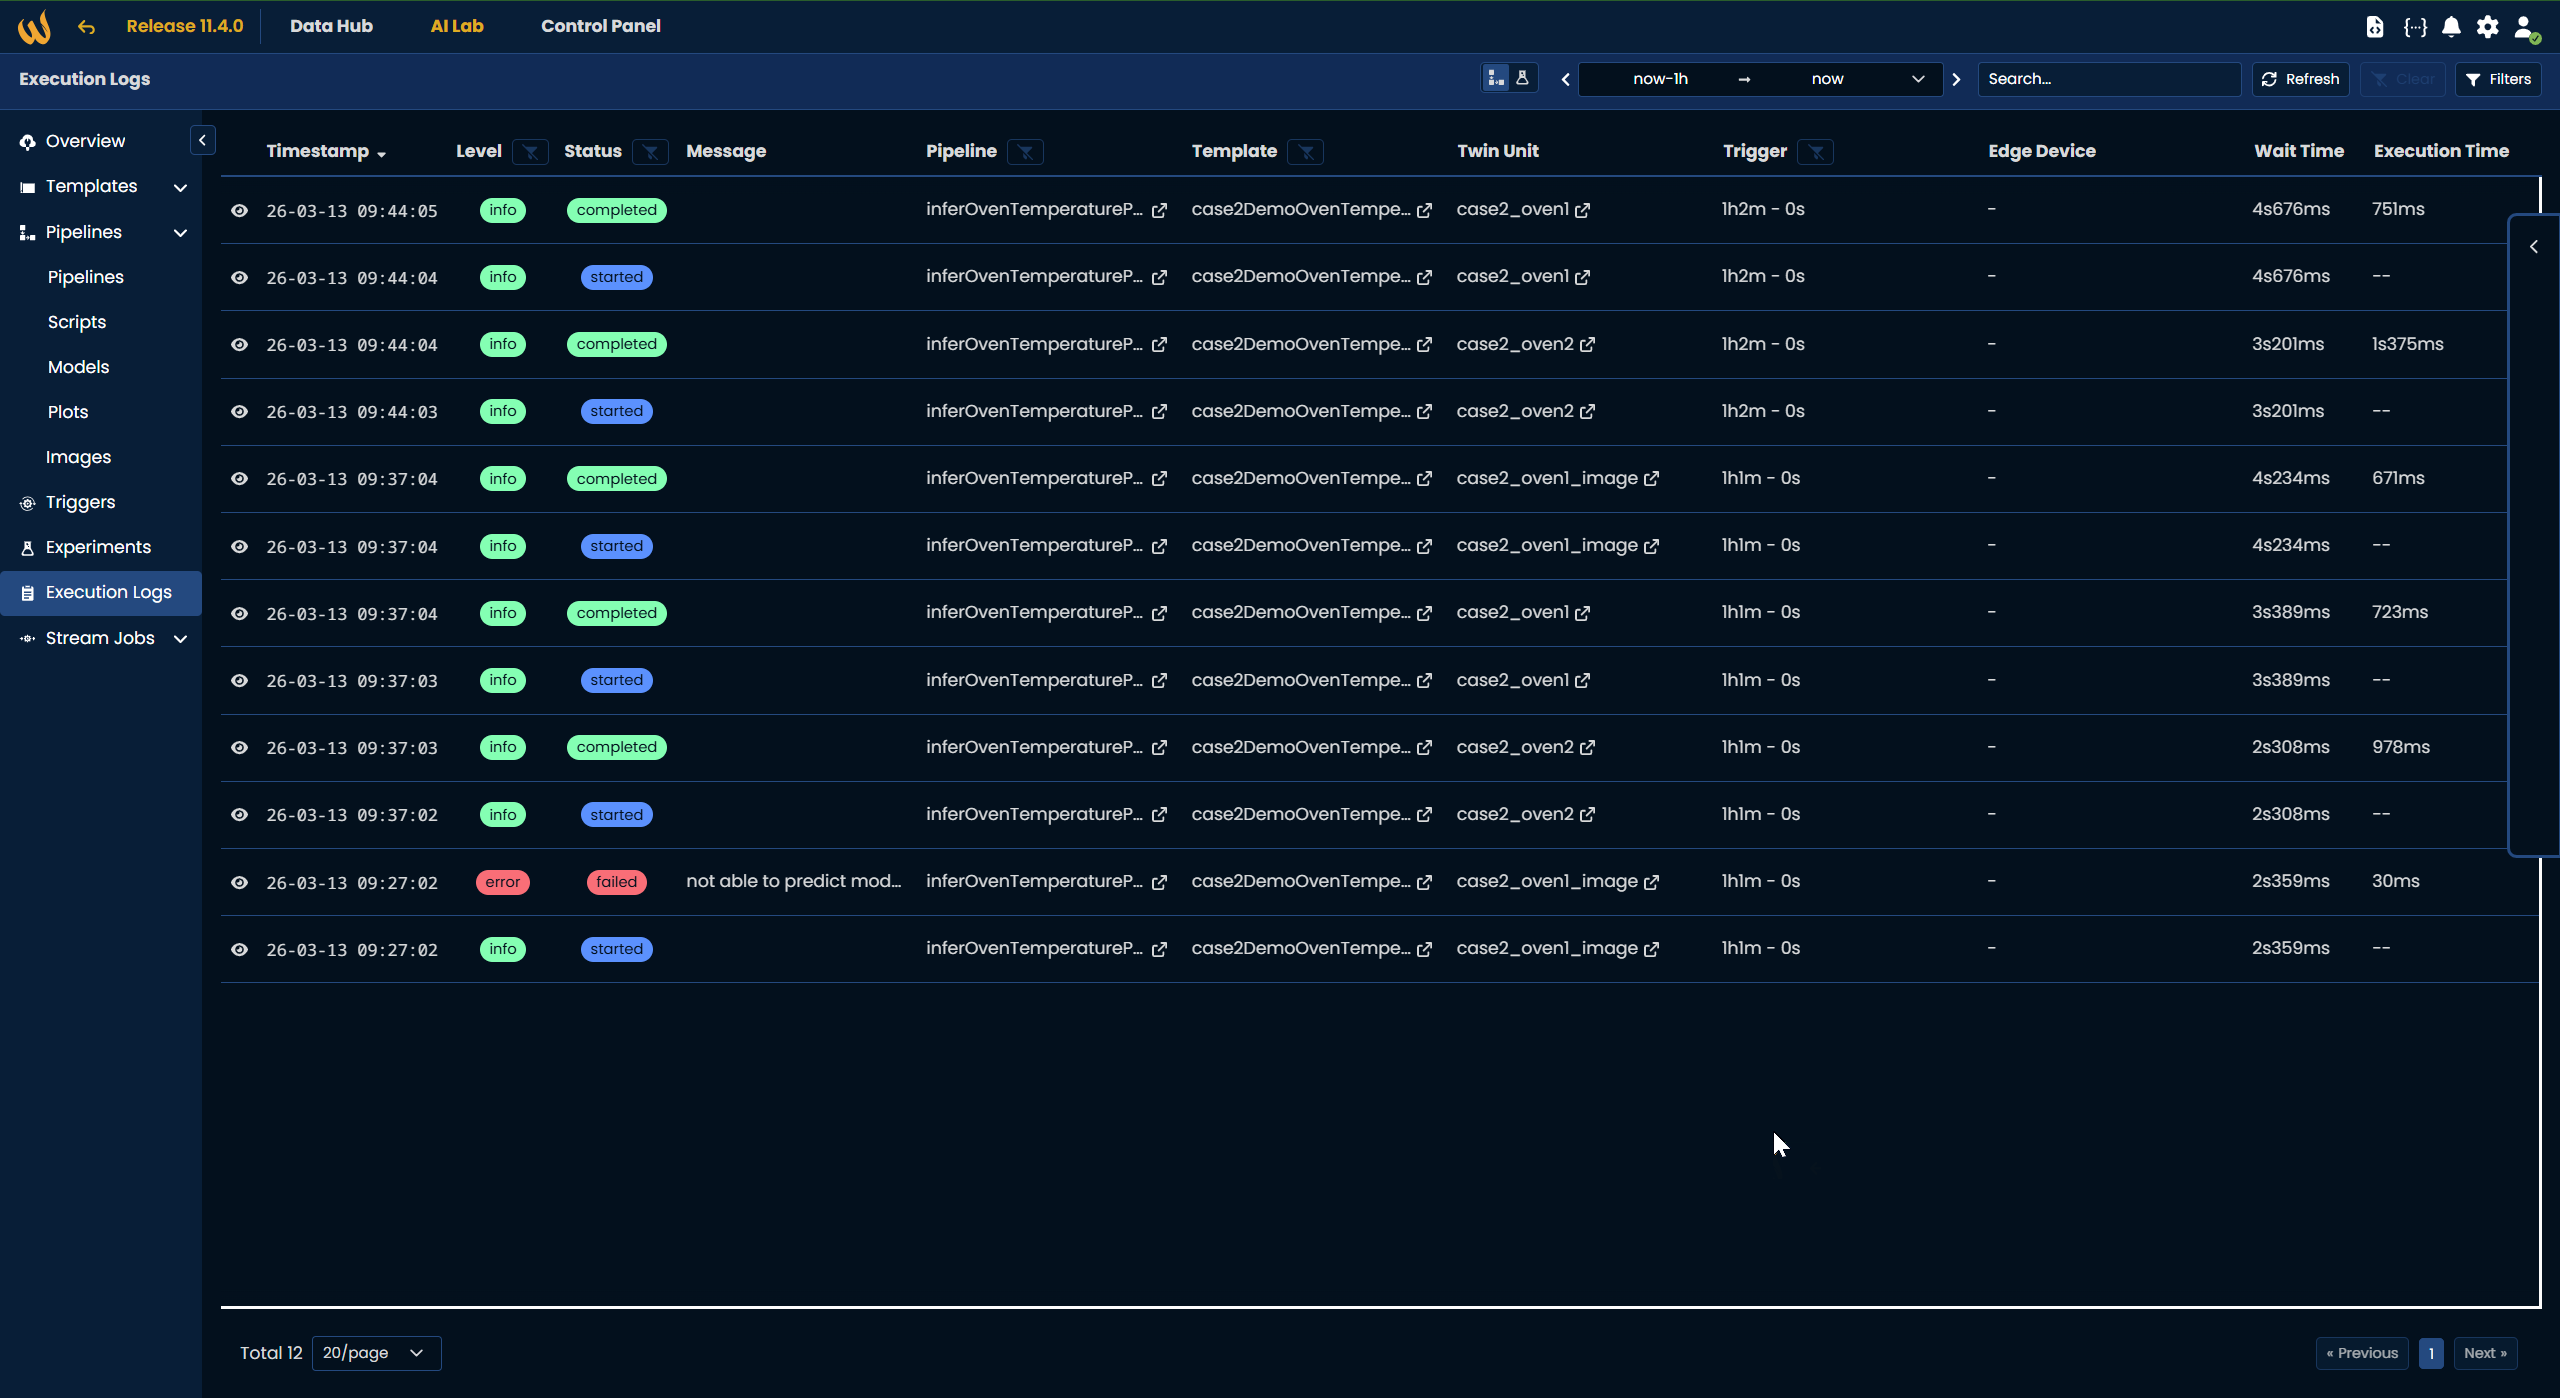
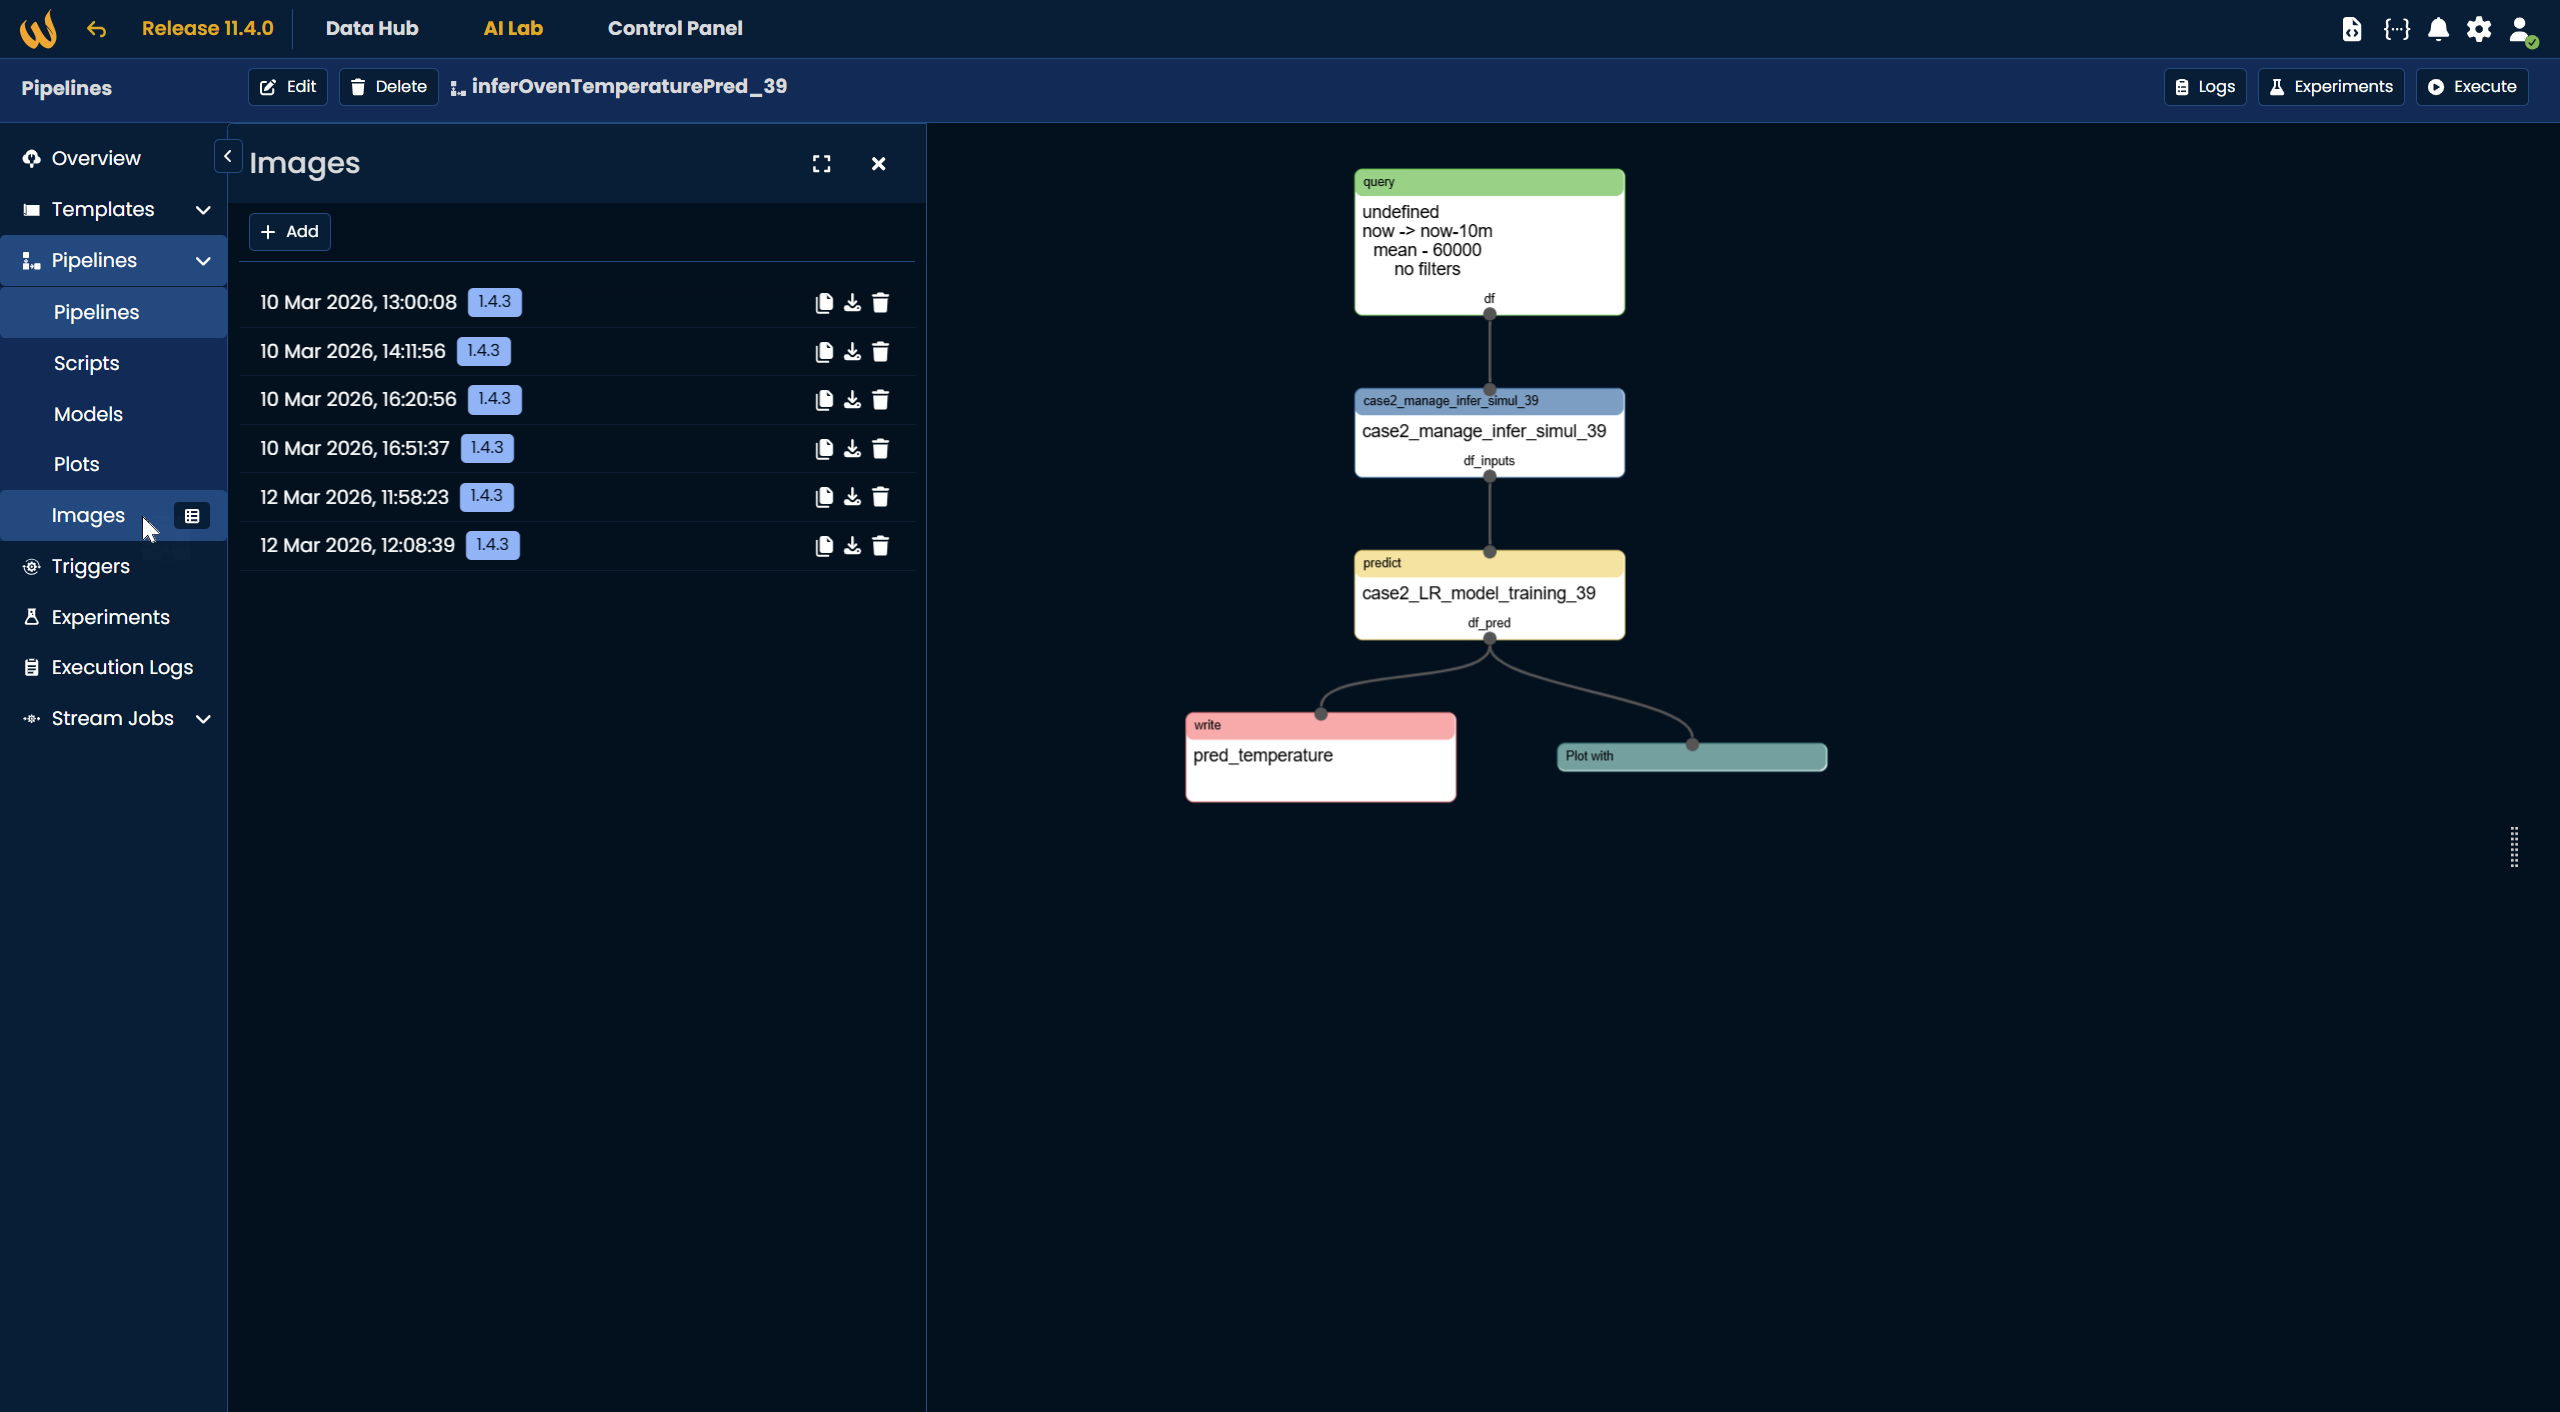
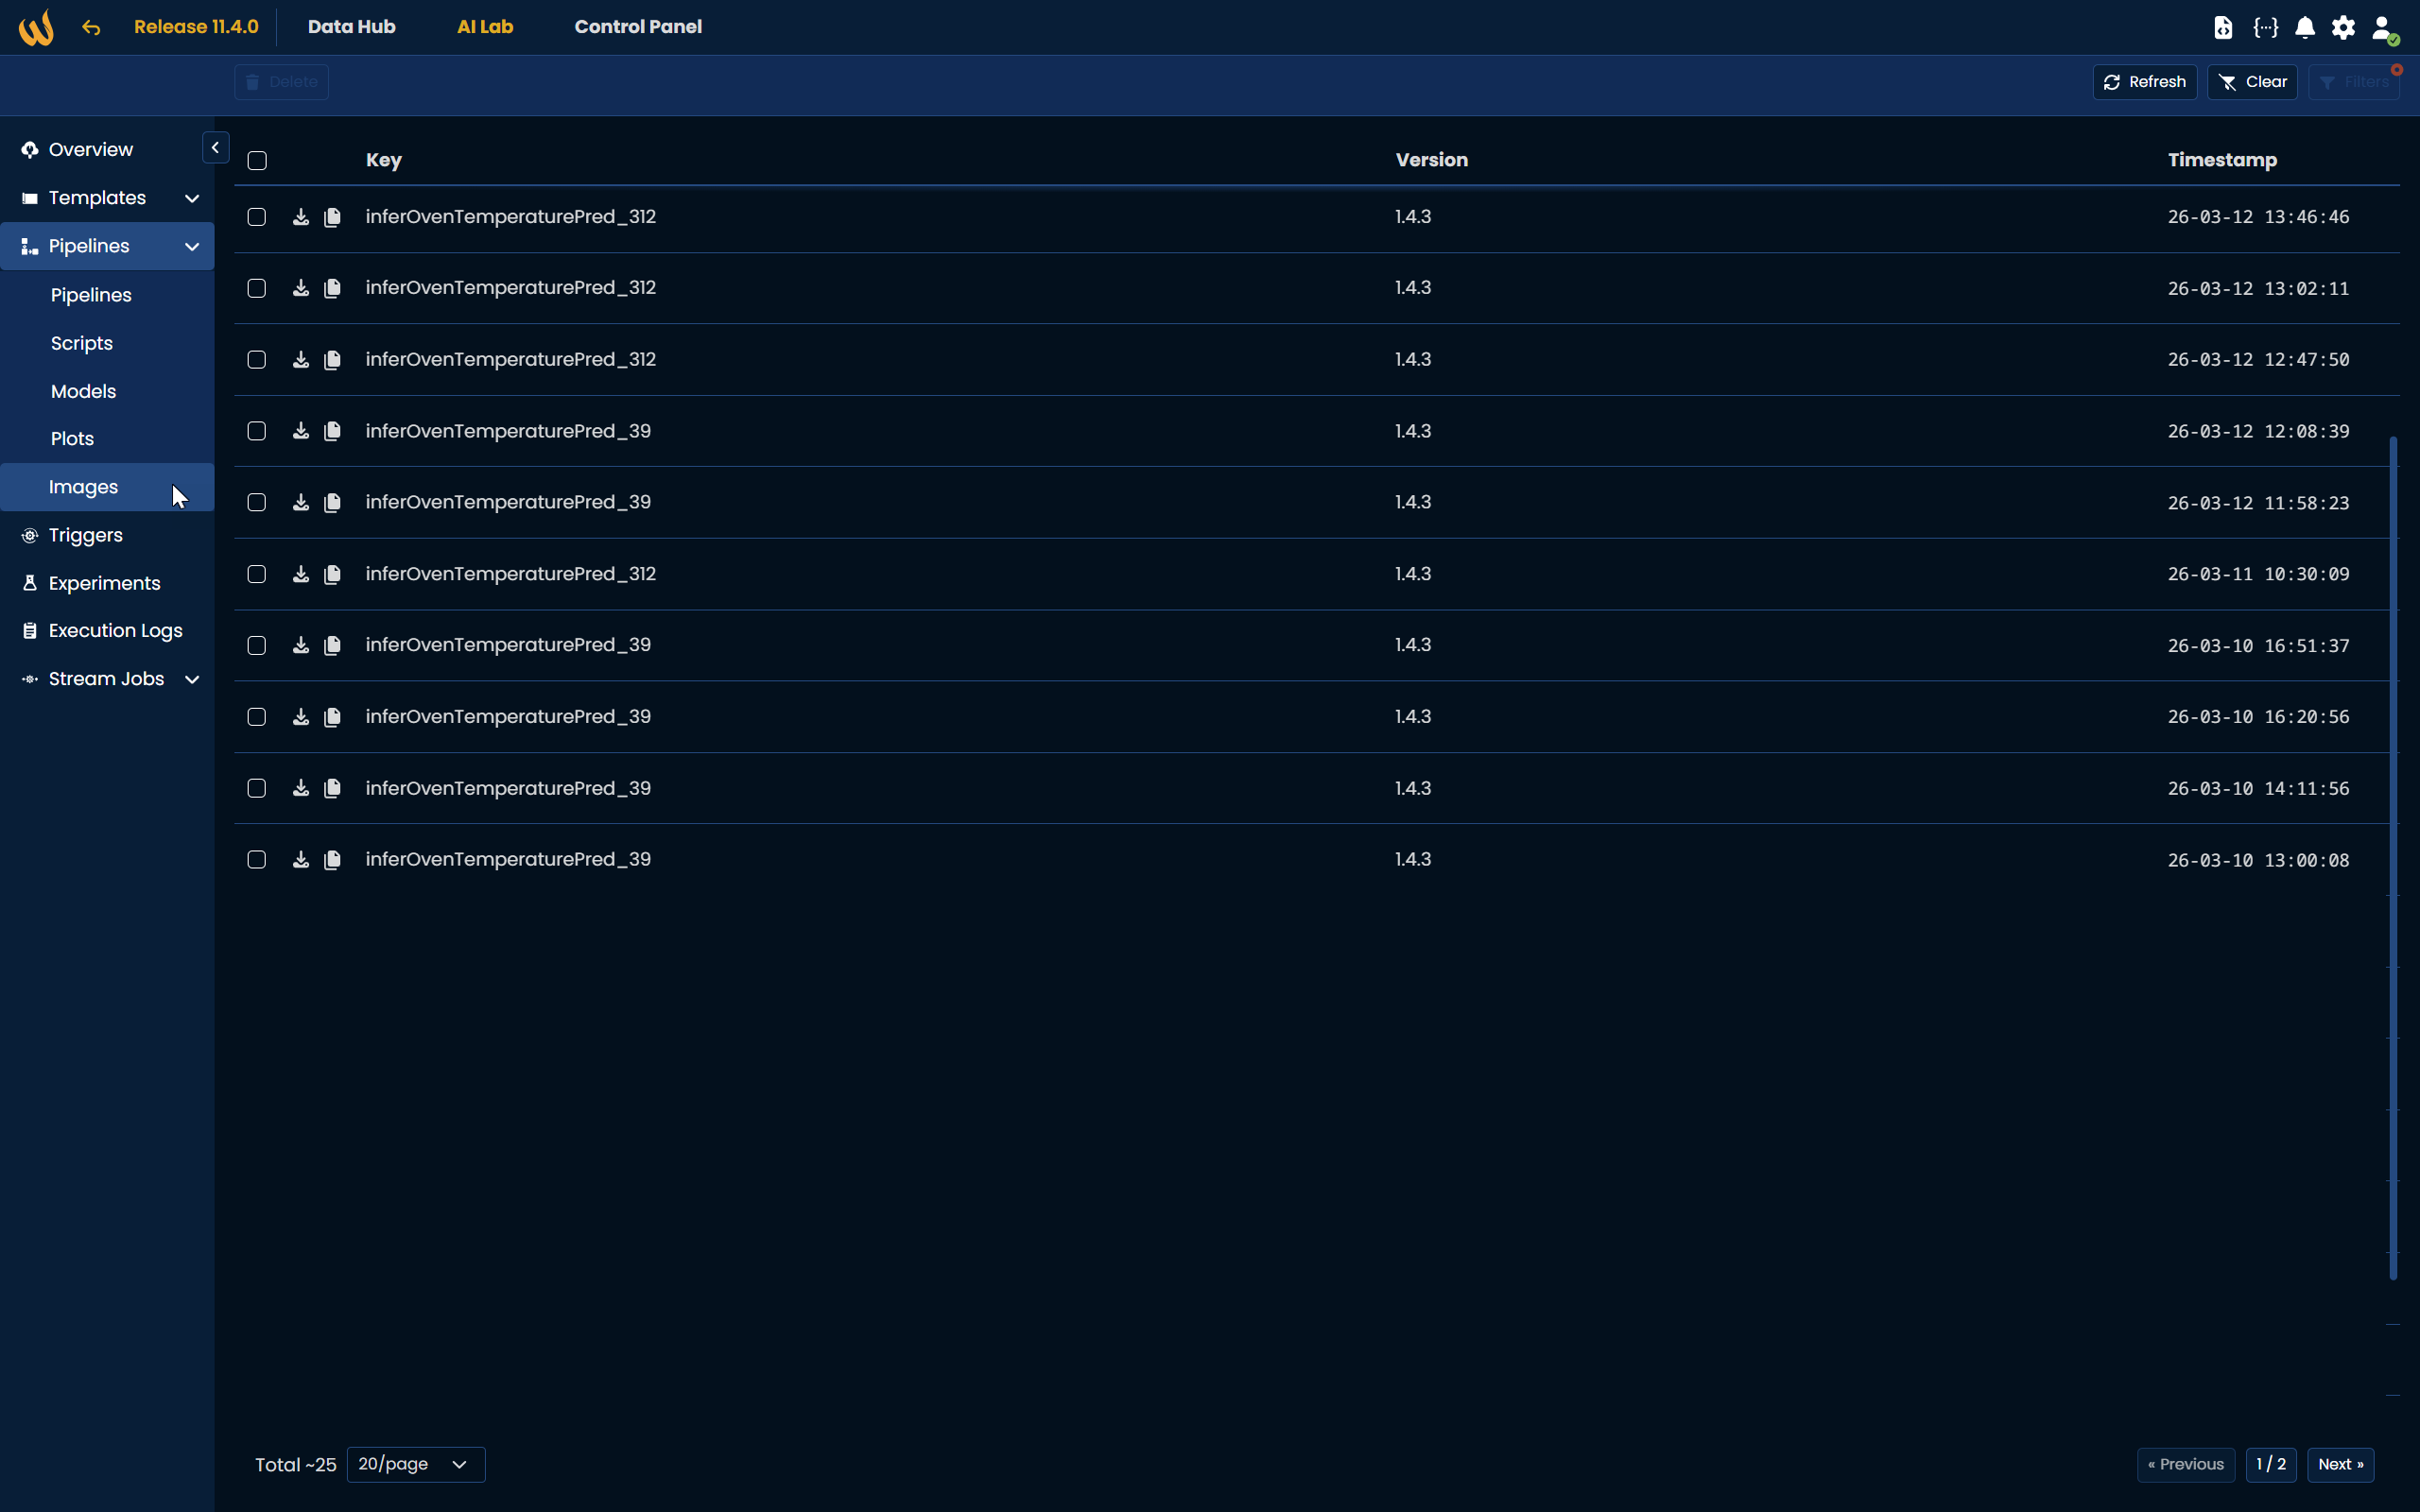
We have reworked web mobile display of UI to properly render the control panel on mobile phone. Navigate to your app with your mobile phone browser and start looking at your favorite browser from your mobile device.

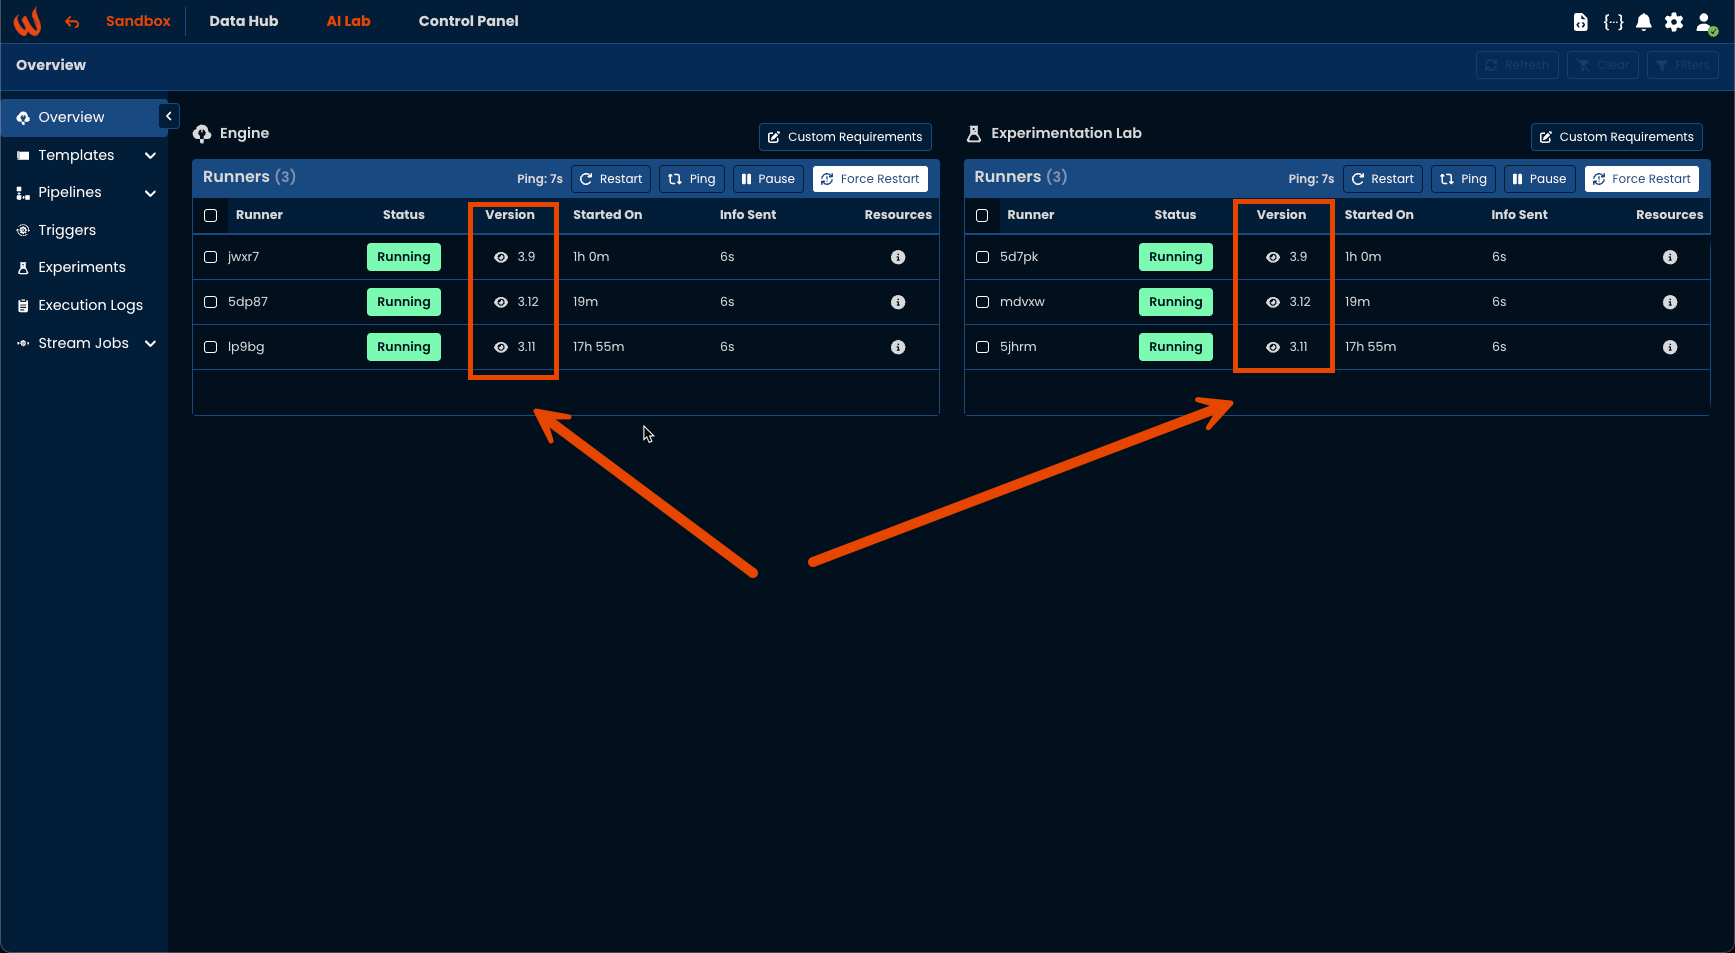
With release 11.1 we introduce full control for your pipeline installation directly from the AI Lab. You can now see how many runners are linked to your environment, and pause, restart or force restart them.

You can consult which python packages are currently installed on the runners.

You can install additional python librairies not included in Wizata runners by yourself including the one you have developed yourself.

You simply have to go to AI lab > Overview, select custom requirements modify the requirements and then restart the runners.

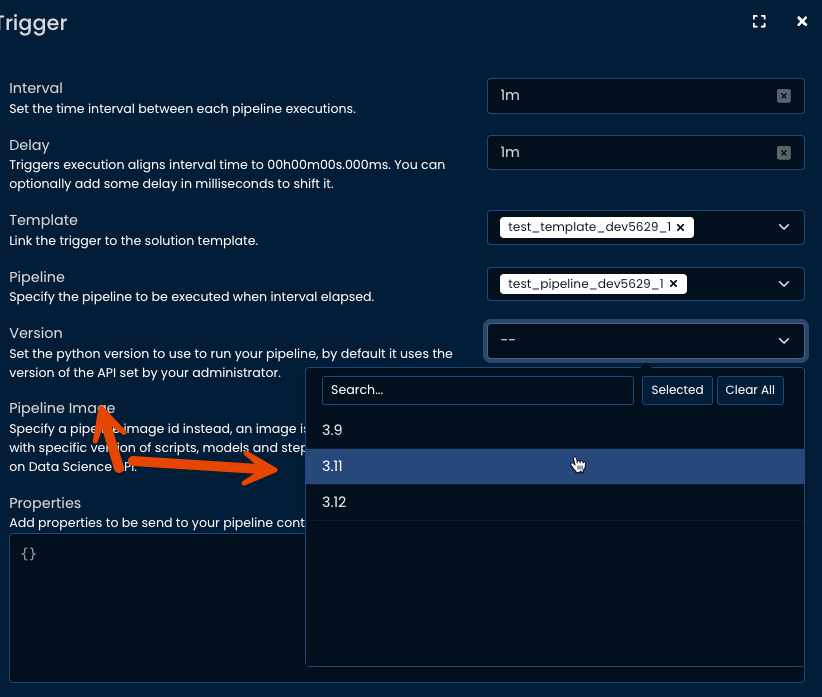
It is also now possible to not have to upsert your function in Wizata but directly reference it within your pipeline by simply adding the library tag. Don't forget to reference your function in init file of your package.

    {
      "type": "script",
      "config": {
        "library": "my_package",
        "function" : "my_function"
      },
      "inputs": [
        { "dataframe" : "input_df" }
      ],
      "outputs": [
        { "dataframe" : "output_df" }
      ]
    }

With release 11.1, we have added dynamic tiles on control panel delivering real time Insights directly to you.

Insights checks real time values against user made condition to show different status and alerts. Learn how to configure them and start creating your first insights.

With it, we have added a favorite option and different filters to let you organise the tiles on your control panel.

Changelog for release version 11.1

Improvements

  • Add a batch_query option in wizata_dsapi to query large dataset
  • Optimize data storage for Execution logs page
  • Added a native modbus client for edge
  • Apply time filters on variables used for Grafana dashboard
  • Add "login assistance" option on user profile to use connectivity to Grafana or other iframe within Control Panel
  • Add a navigate back button on main top bar
  • Add access to data explorer for "operate user" role
  • Improve design of multi-value selector
  • Add support for email alerts on pipeline
  • Add support for slack and teams alerts on pipeline using webhook
  • Add support for auto-refresh interval on components for Grafana dashboards
  • Improved un-authorized error page
  • Add custom permissions for DS API
  • Add Rounded Intervals and Timestamp for end plotly widget time selection
  • Add license management directly on UI
  • Add a failover queue option for Rabbit MQ data connection.
  • Add Wizata native function on librairies and make them available directly on python toolkit
  • Add new fields support on time-series database write endpoint
  • Change default values for experiment execution properties
  • Add "reliability" as field on time-series data structure
  • Add light view mode support for Grafana
  • Add proper management of relative time on time selector of control panel for Grafana support
  • Sorts assets properly on control panel based on twin structure
  • Allow pipeline to write data on another influx bucket
  • Allow query to use different bucket through declaring "Data Store"
  • Allow multi-group query from event data
  • Add support for multi-buckets and extra tags querying on DS API queries
  • Improve error handling on triggers

Bug Fixes

  • Fix an issue using wrong behaviour on edit mode of a dashboard in control panel
  • Fix a bug where API is returning an empty list on non existant datapoints
  • Fix quadratic regression type on data explorer
  • Fix a crash when navigating to control panel with opened properties
  • Fix filters on related page using pagination
  • Fix an issue parsing some pipeline JSON on UI
  • Improved error message for failed import on pipeline
  • Fix get all datapoints search methods on python toolkit
  • Fix an issue with WindRose widget for Influx 2.x
  • Fix an error using the send_alerts method on pipeline
  • Improved stability of triggers over long periods
  • Fixed an issue with twin structure parsing on UI selector
  • Fix an issue with redirection on experiment page
  • Hide random appearing checkbox on user edit panel
  • Fix autofiltering for plotly widget for Influx 2.x
  • Fix a bug to allow null extra properties on datapoint
  • Fix a bug on .plots() method using new execution id
  • Allow emptying default from/to value on grafana dashboard
  • Fix an issue with access_check function for streamlit
  • Remove restriction for 8000 characters of pipeline JSON

We have been reimagining and reinventing how to deal with event and batch data within Wizata. This new solution creates foundation to store event/batch data within Wizata and analyse them. It can be useful to track batch number, cluster anomalies and alerts, or simply track working shifts.

The solution have been developed including native support with the time-series database and queries within the data science API. You can query data using the event ID stored within the platform even when this event happens at different time on different machine.

e.g. query vibration of same batch across multiple twin motors using datapoint events to link them.

e.g. query vibration of same batch across multiple twin motors using datapoint events to link them.

Learn more on Events & Batches added within version 11.0.2

Changelog for release version 11.0.2

Improvements

  • Add Rabbit MQ and AMQP as native protocol supported within edge data connect
  • Add native support to show a streamlit app within the control panel
  • Add "Is Empty" condition on filters and on charts
  • Improved Security Roles for read-only and operate users
  • Accept '*' wildcards character as list of input datapoints on edge writers
  • Allow querying raw data within the DS API
  • Allow querying another Influx bucket on Influx 2+

Bug Fixes

  • Fixed an issue with filtering datapoints by business type
  • Fixed an issue with security on API streams
  • Fixed an issue while saving a data explorer view with Python custom code within
  • Fixed beta pipeline UI loading when opening a second time the page
  • Fixed an issue allowing user to delete business labels used within control panel
  • Fixed an issue not showing the right execution on experiment form
  • Fixed an issue while using the chart filters not reset properly
  • Fixed small visual issues on various page titles
  • Fixed grafana dashboard replication within control panel