Execution
An Execution tracks all information on time, status and results of a specific pipeline run, whether triggered manually or automatically. It contains the following information:
- status: queued, started, abort requested, aborted, failed, completed
- pipeline: the pipeline that has been or is going to be executed
- template: the template if referenced on your pipeline and/or trigger
- twin: the twin on which the pipeline is run. While a Trigger can specify multiple twins, it creates one execution per twin
- queued, started, created, updated dates and execution and waiting time: useful information on timing and duration.
Executions are always processed asynchronously through a queue. The experiment() and run() methods return an ExecutionLog immediately, but the pipeline may not yet be completed at that point.
Running a Pipeline
Experiment mode
Using Python or the UI, you can test your pipeline and execute it as an Experiment . Experiment mode trains models, generates plots, but does not write data back to the platform by default.
Production mode
To run a pipeline in production mode, use the run method:
execution = wizata_dsapi.api().run(
    pipeline='my_pipeline',
    twin='my_twin'
)
By default, in production mode no models are trained and no plots are produced. You can override this behavior using the same parameters as in experiment mode:
# Override default production behavior
execution = wizata_dsapi.api().run(
    pipeline='my_pipeline',
    twin='my_twin',
    train=True,
    plot=False,
    write=True
)

# Set Python version manually
execution = wizata_dsapi.api().run(
    pipeline='my_pipeline',
    twin='my_twin',
    version='3.12'
)
To check which Python versions are available in your platform, navigate to AI Lab > Overview. For more information refer to the Upgrade your solution Python version article.
Viewing Results
Execution Logs
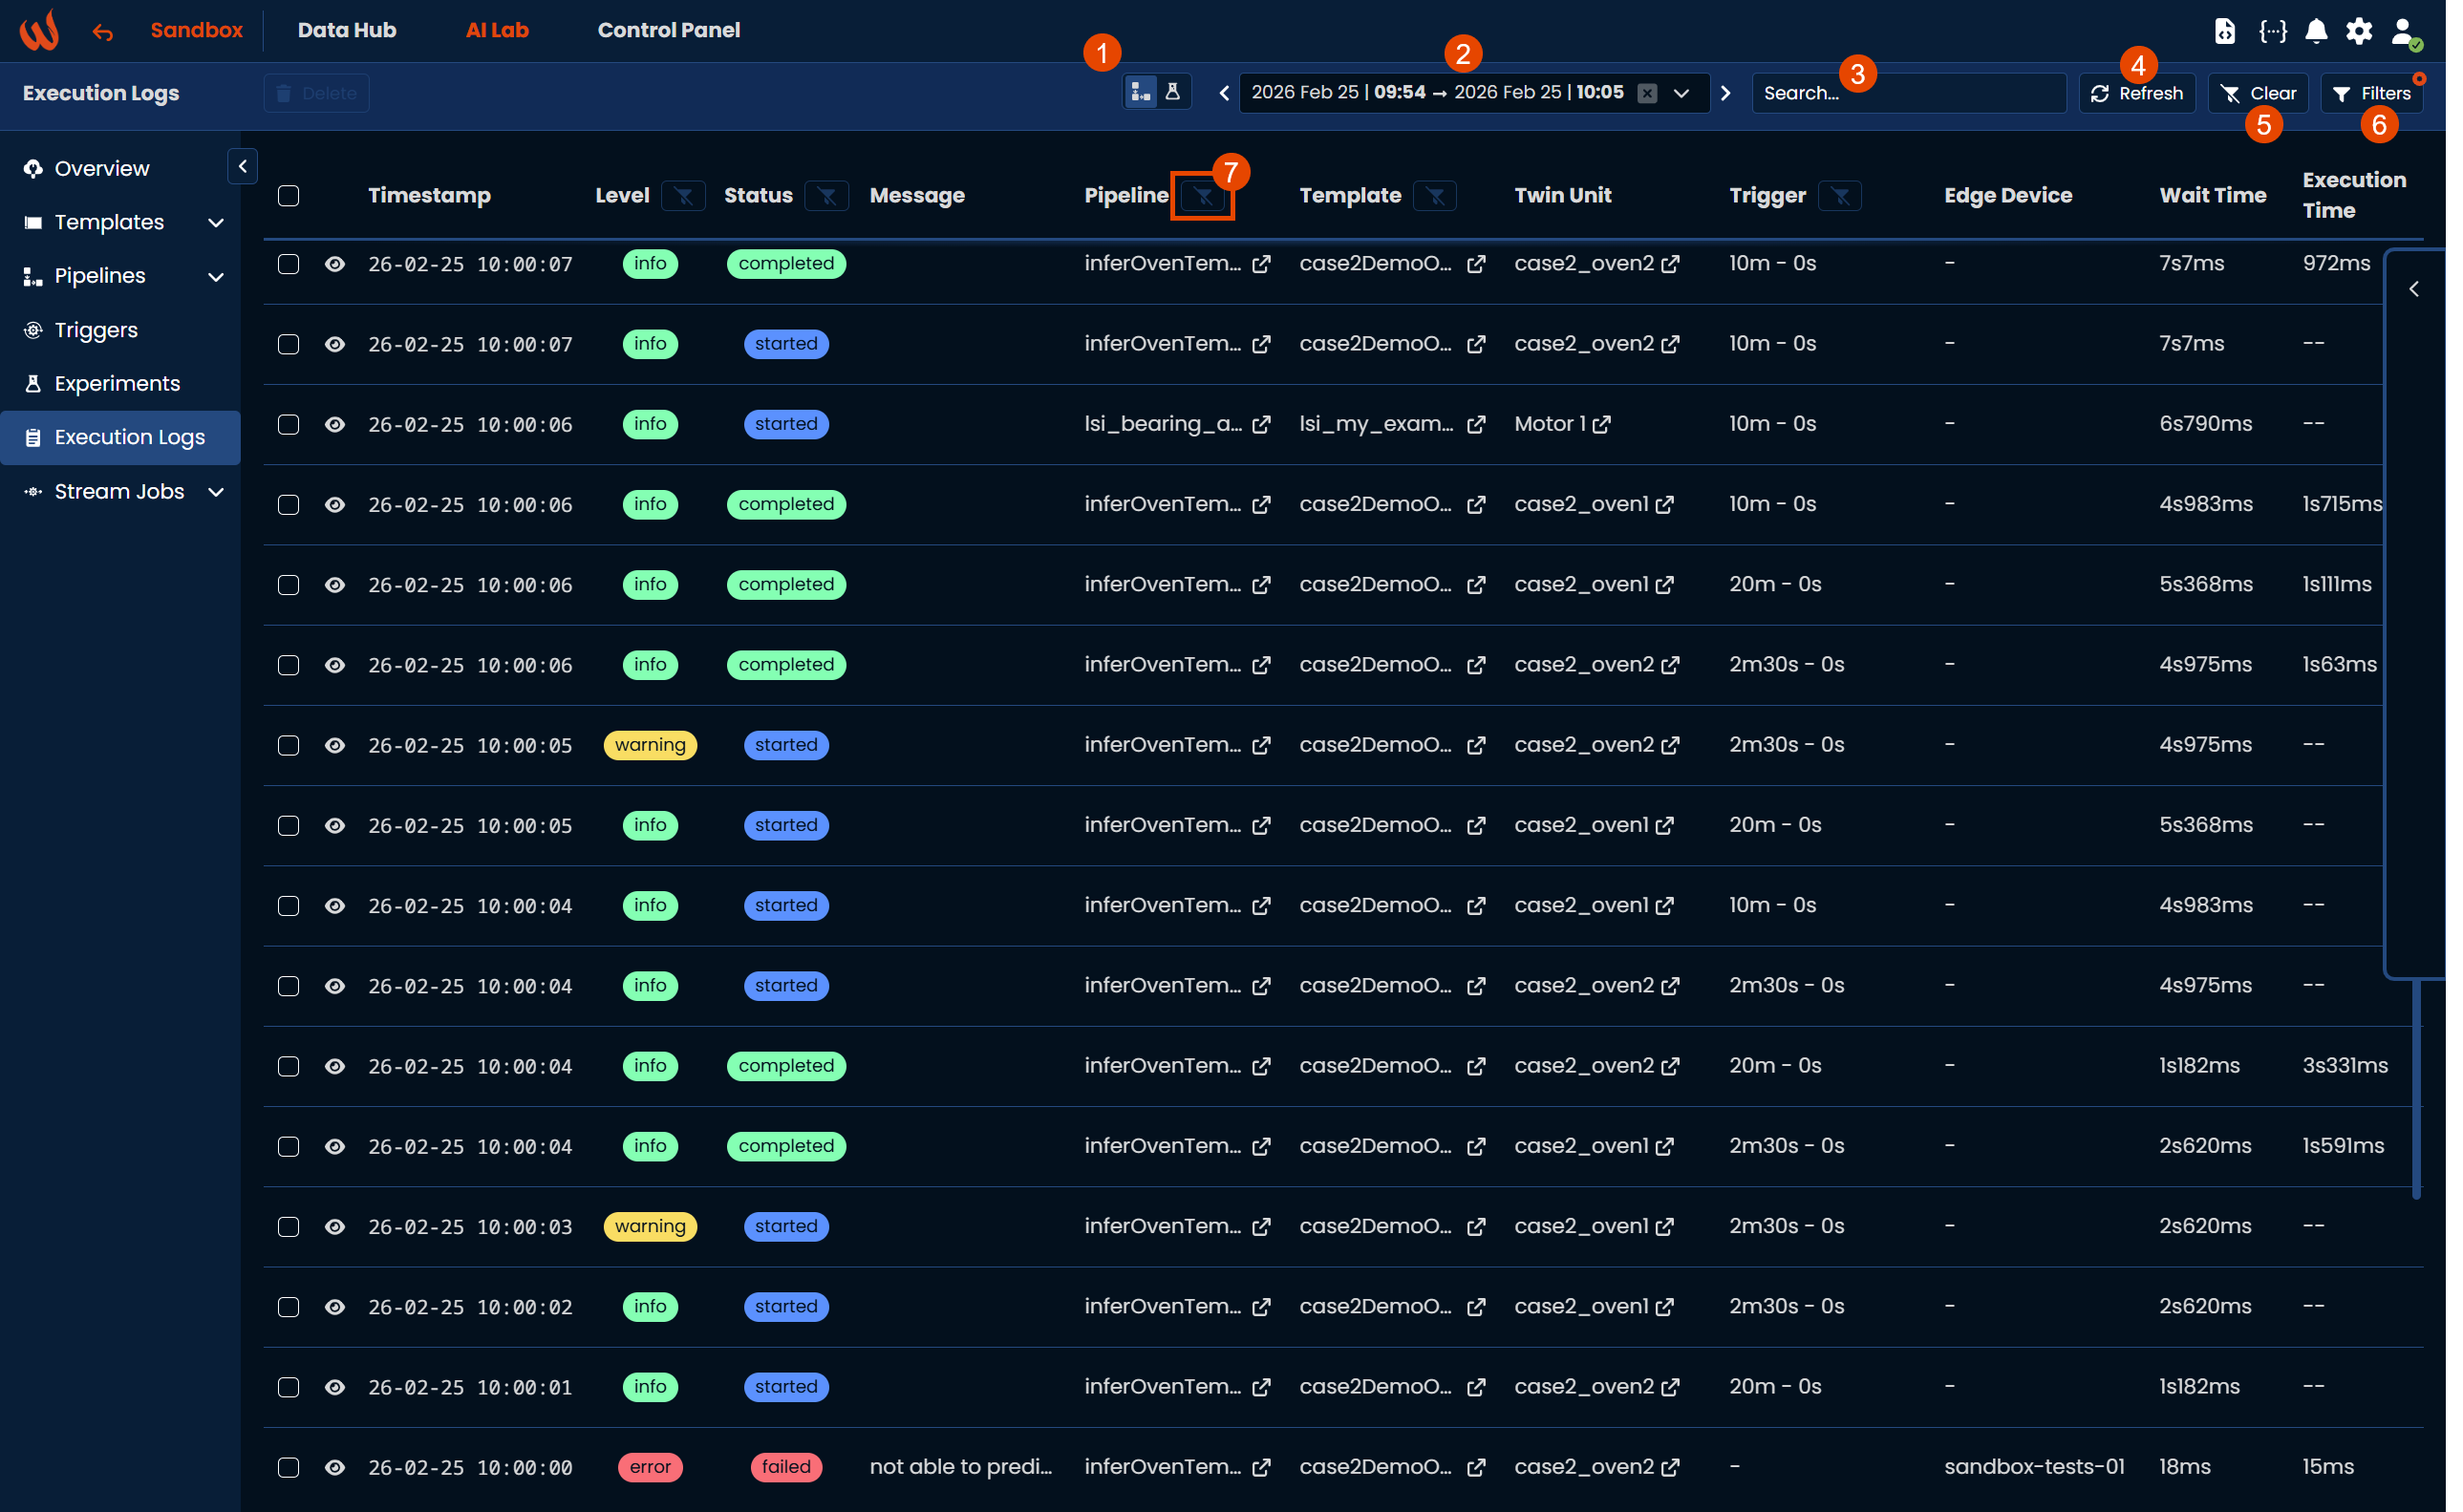
From the global Execution Logs page in AI Lab you can view all executions across all pipelines. The following actions are available in the top toolbar:
- Select between production run or experiment run (1)
- Time Range Selector: define a start and end date/time window to narrow down the logs (up to 30 days) (2)
- Search: find specific executions by typing keywords, names, or messages (3)
- Refresh: fetch and display the most recent execution data (4)
- Clear: remove any applied filters or search queries to reset the default view (5)
- Filters: open an advanced menu to filter logs based on specific parameters (6)
Within the table itself you can also:
- Delete executions by selecting them with the checkboxes and using the top-left button
- View Details by clicking the eye icon next to any log to inspect the specific details of that execution
- Column Filters by clicking the funnel icon next to headers like Level, Status, Pipeline, Template, and Trigger (7)
Production Logs in the Pipeline Editor
When working within a specific pipeline, you can view its execution history directly from the Pipeline Editor by navigating to the Production Logs tab. This gives you a focused view of all executions associated with that pipeline without having to navigate to the global Execution Logs page.
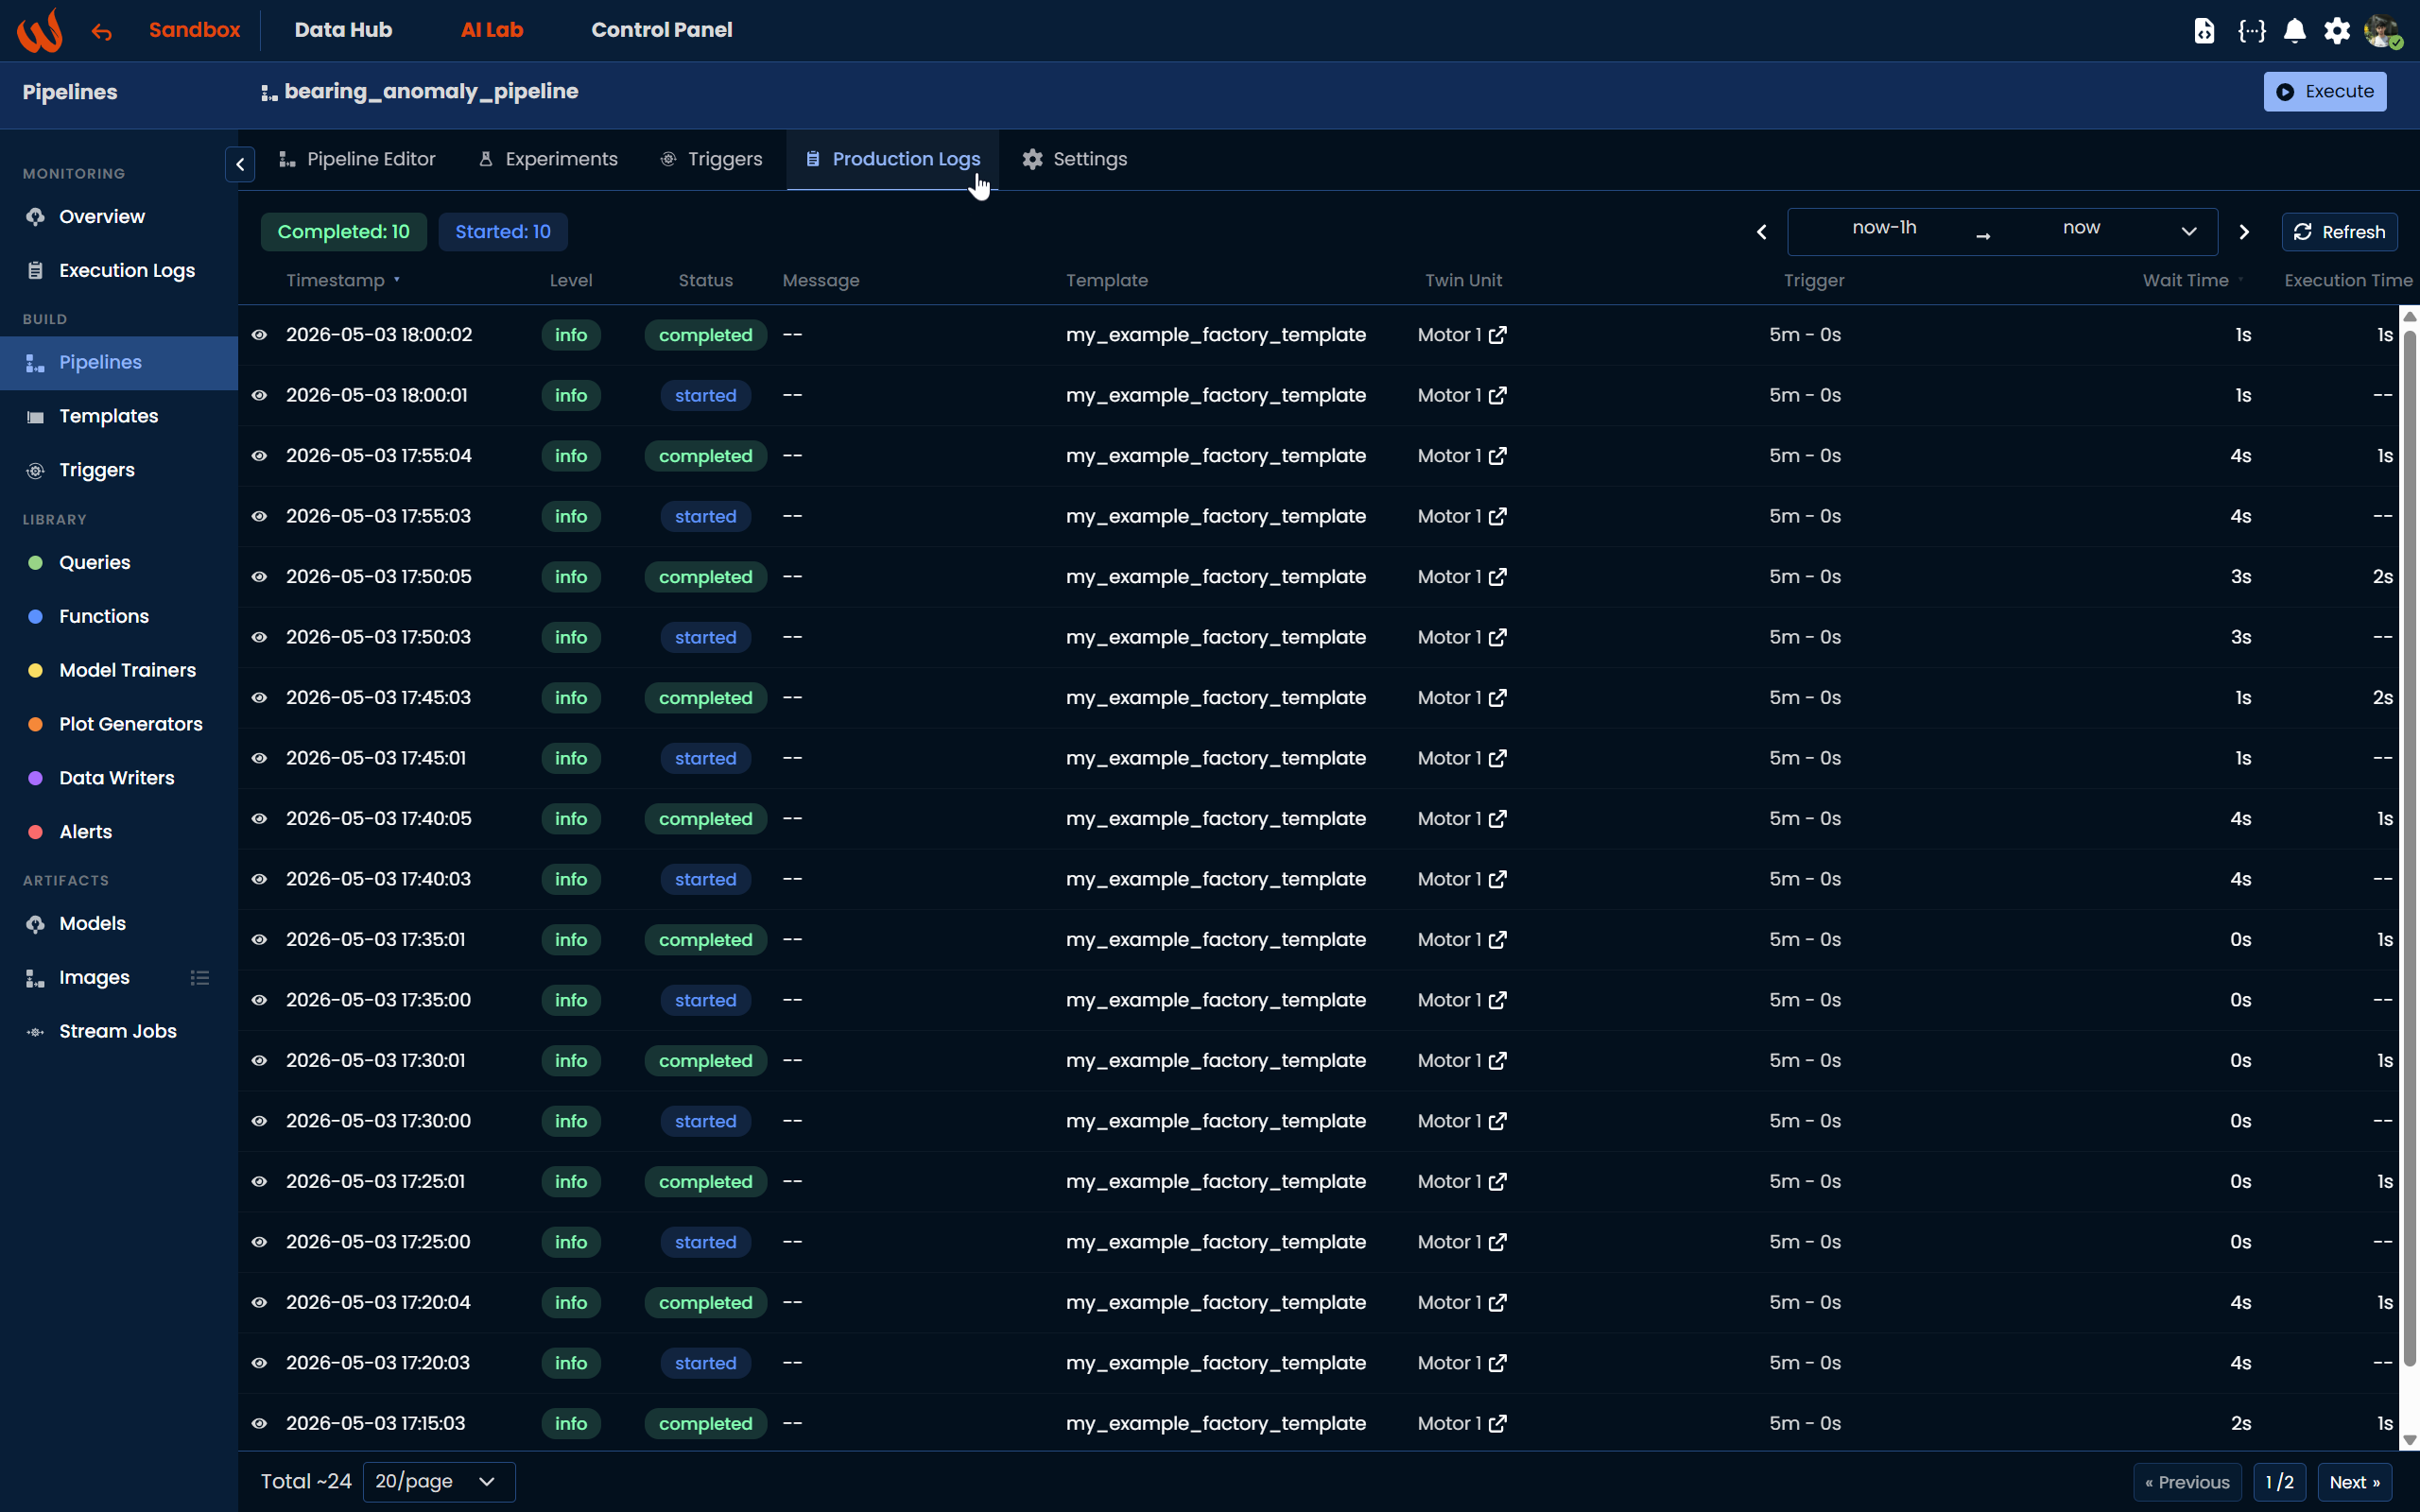
If you hover over the Warnings column, you can find more information about failed executions. Clicking the eye icon shows a JSON formatted view with all execution details including the status and warning variables.
Awaiting Execution
Since executions are processed asynchronously, you can use await_execution() to wait for a pipeline to complete before continuing:
execution = wizata_dsapi.api().run(
    pipeline='my_pipeline',
    twin='my_twin'
)

# wait for the execution to complete (default timeout: 180s)
result = wizata_dsapi.api().await_execution(execution)
print(result.status)
You can customize the timeout and polling interval:
result = wizata_dsapi.api().await_execution(
    execution,
    timeout=300,       # max seconds to wait
    poll_interval=10   # seconds between status checks
)
await_execution() raises a TimeoutError if the execution does not complete within the timeout, and a RuntimeError if the execution finishes with a failed or aborted status.
Retrieving Plots
If your pipeline produces plots, you can retrieve them programmatically after execution:
plots = wizata_dsapi.api().plots(execution)Search Execution Logs
You can search execution logs programmatically using the search_execution() method. It accepts a SearchQuery object or its dictionary equivalent to filter, sort, and paginate results.
The following example retrieves execution logs from the last 7 days for a specific pipeline:
from datetime import datetime, timedelta, timezone
import wizata_dsapi

now = datetime.now(timezone.utc)
one_week_ago = now - timedelta(days=7)

now_ms = int(now.timestamp() * 1000)
one_week_ago_ms = int(one_week_ago.timestamp() * 1000)

results = wizata_dsapi.api().search_execution({
    "filters": {
        "pipeline": {"eq": "my_pipeline_key"},
        "startedDate": {"gte": one_week_ago_ms, "lte": now_ms}
    },
    "sort": [{"field": "queuedDate", "order": "desc"}],
    "page": 1,
    "size": 20,
    "serviceName": "pipeline_runner"
})

for log in results.results:
    print(log.execution_id, log.status, log.execution_time)
The method returns a PagedQueryResult containing the matching ExecutionLog entries and pagination metadata.
If there are more results than the page size, you can iterate through all pages:
all_logs = []
page = 1
size = 100

now = datetime.now(timezone.utc)
one_day_ago = now - timedelta(days=1)

now_ms = int(now.timestamp() * 1000)
one_day_ago_ms = int(one_day_ago.timestamp() * 1000)

while True:
    results = wizata_dsapi.api().search_execution({
        "filters": {
            "pipeline": {"eq": "my_pipeline_key"},
            "startedDate": {"gte": one_day_ago_ms, "lte": now_ms}
        },
        "sort": [{"field": "queuedDate", "order": "desc"}],
        "page": page,
        "size": size,
        "serviceName": "pipeline_runner"
    })

    all_logs.extend(results.results)

    if page * size >= results.total:
        break
    page += 1

print(f"Retrieved {len(all_logs)} execution logs out of {results.total}")
You can also perform a free-text search across execution log messages using the _search filter:
results = wizata_dsapi.api().search_execution({
    "filters": {
        "_search": {"query": "my search text"},
        "pipeline": {"eq": "my_pipeline_key"},
        "startedDate": {"gte": one_day_ago_ms, "lte": now_ms}
    },
    "sort": [{"field": "queuedDate", "order": "desc"}],
    "page": 1,
    "size": 20,
    "serviceName": "pipeline_runner"
})
Updated 2 months ago