Jupyter Notebook
This tutorial provides step-by-step guidance on how to use the Wizata Python Toolkit inside a Jupyter Notebook.
Wizata Python toolkit Installation
It is highly recommended to first read our dedicated article on how to quickly start using the Wizata Python toolkit.
Make sure your notebook is running Python 3.9
from platform import python_version
print(python_version())
Verify that the wizata_dsapi package is installed in your environment. If not, install it and import it as import wizata_dsapi
Then, set your environment variables to connect to Wizata
%env WIZATA_TENANT_ID=xxxxxxxx-xxxx-xxxx-xxxx-xxxxxxxxxxxx
%env WIZATA_CLIENT_ID=xxxxxxxx-xxxx-xxxx-xxxx-xxxxxxxxxxxx
%env WIZATA_SCOPE=xxxxxxxx-xxxx-xxxx-xxxx-xxxxxxxxxxxx/api
%env WIZATA_DOMAIN=xxx-wizard.onwizata.com
%env WIZATA_CLIENT_SECRET=xxxxxxxxxxxxxxxxxxxxxxxxx
Do not use double quotation (”) in variable value.
Fetching a Dataframe
You can easily access the client using the environment variables and the api() method: wizata_dsapi.api()
See our Python SDK documentation for a complete list of available methods and attributes.
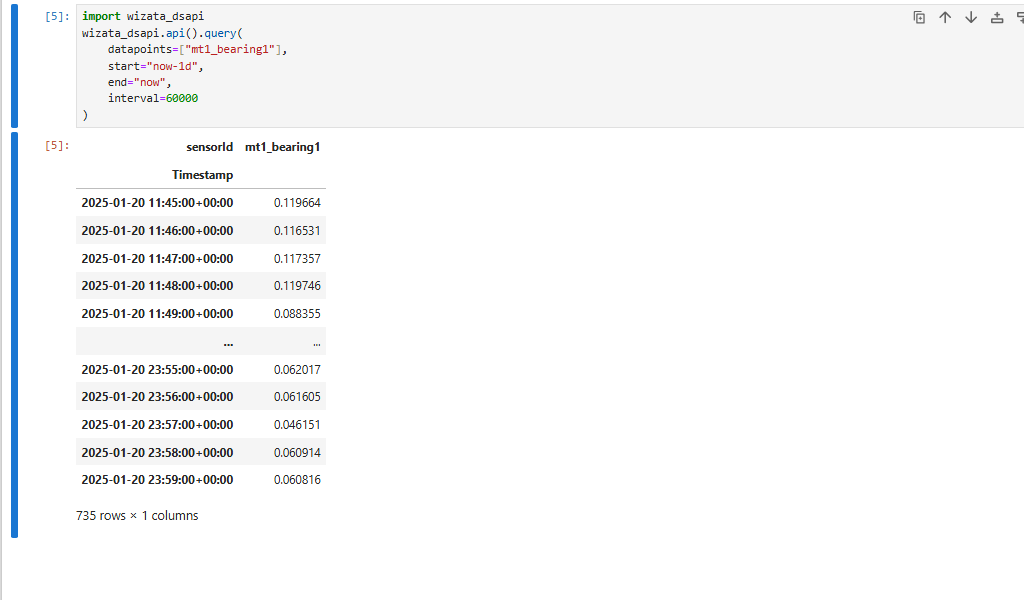
If you've followed the guide on how to upload a small data file through Azure Event Hub, you can query data using:
import wizata_dsapi
wizata_dsapi.api().query(
    datapoints=["mt1_bearing1"],
    start="now-1d",
    end="now",
    interval=60000
)
Additionally, you can transform data, plot it, or train models using Pipelines. See our dedicated guide on how to create an Anomaly Detection Solution
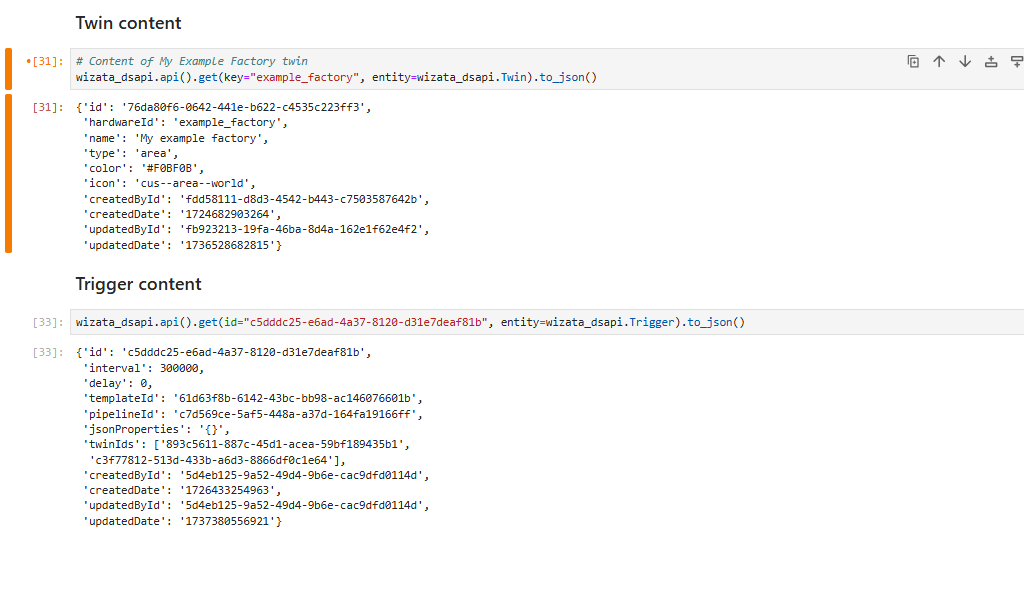
Visualizing entities content
Wizata Python toolkit also includes to_json() method for all the entities on the platform, to print their contents directly in your notebook:
Showing plots
You can visualize any Wizata plot within your notebook. Using the helper method wizata_dsapi.api().plot(), you can pass an id, a figure or a Wizata DSAPI Plot object.
For instance, recalling from the example in our Anomaly Detection Solution, you can use the .get() method passing the plot title as a key to get a Plot object, and use .plot() passing the object to visualize the plot in your notebook.
plot = wizata_dsapi.api().get(key="Bearing Anomaly Detection",entity=wizata_dsapi.Plot)
wizata_dsapi.api().plot(plot=plot)
Or by passing the plot's ID:
wizata_dsapi.api().plot("dce9e14d-e0f7-48ea-90ce-08236cd830ca")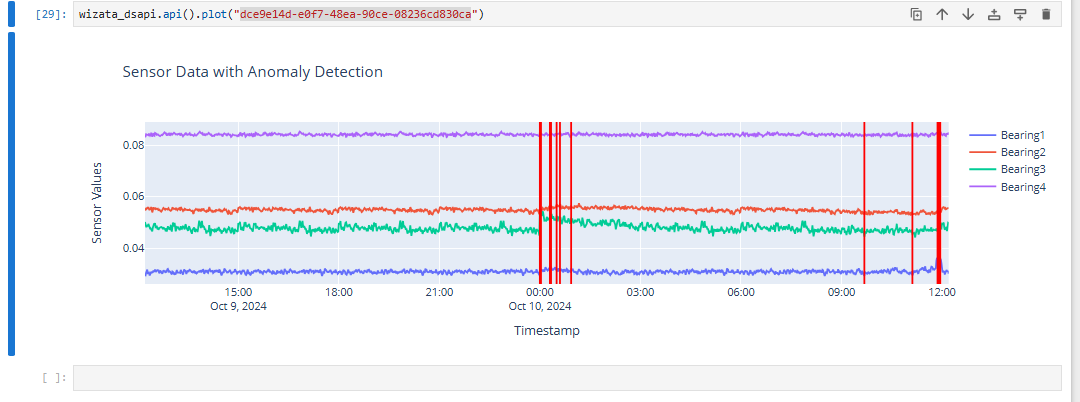
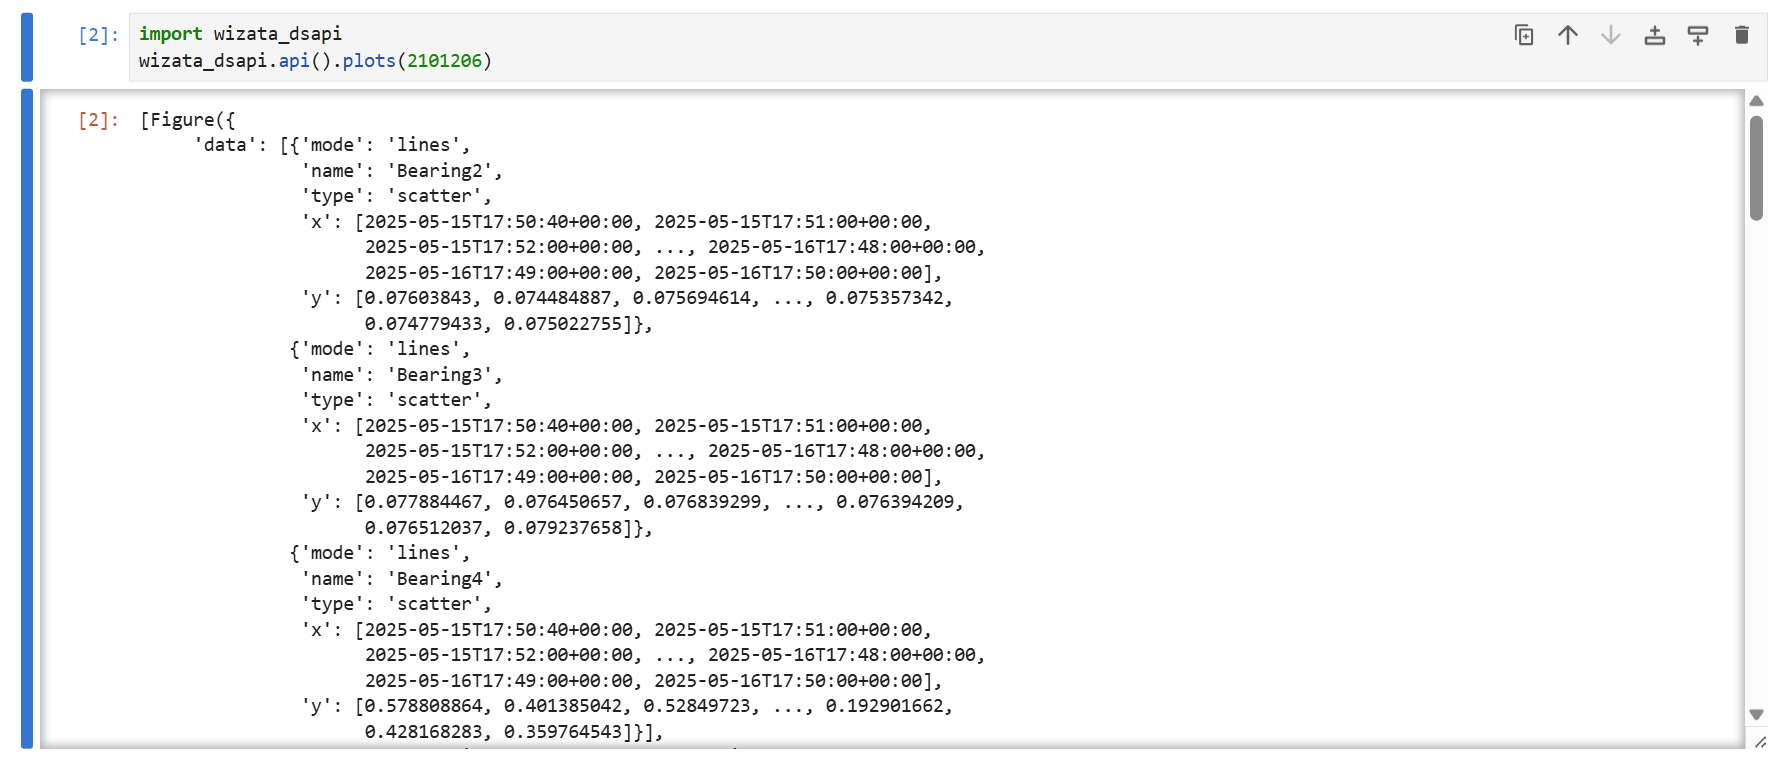
Using .plots() to retrieve multiple figures
.plots() to retrieve multiple figuresYou can use .plots() method to get a list of Plotly figures from a specific execution. It accepts either an execution object or an execution ID:
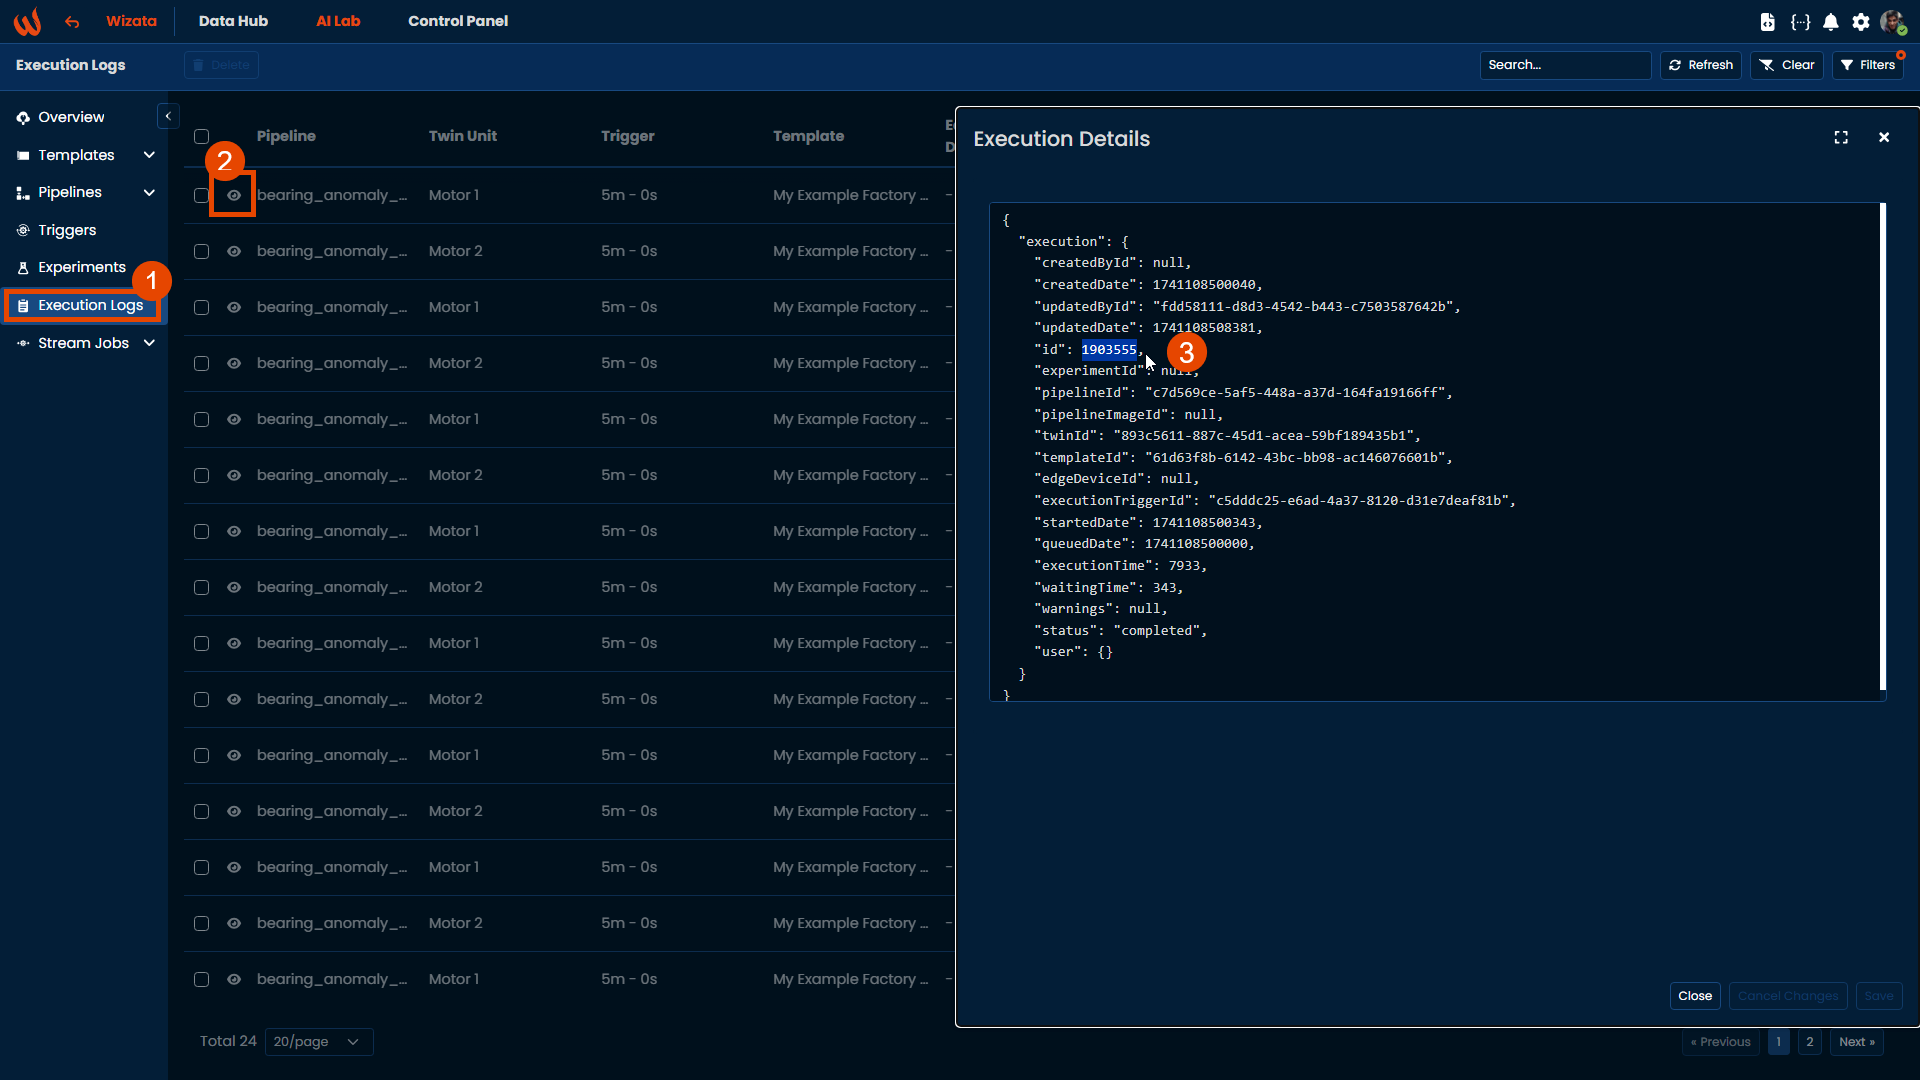
You can find your execution ID from the platform, by checking on the Execution logs page
Or via Python, using the .search_executions() method, that will retrieve a PagedQueryResult with all the executions that matches your filters:
pipeline_id = wizata_dsapi.api().get(pipeline_key="bearing_anomaly_pipeline").pipeline_id
i = 1
page_size = 20
total = None
has_more = True
execution_list = []

while has_more:
    response_paged = wizata_dsapi.api().search_executions(page=i, pipeline_id=pipeline_id, size=page_size)
    if i == 1:
        total = response_paged.total

    for execution in response_paged.results:
        if execution.plots:
            execution_list.append(execution)

    total -= page_size
    i += 1
    if total <= 0:
        has_more = False
For more information you can check our dedicated Python SDK article.
Updated 9 months ago