Data Points
The following articles will cover all the information regarding data points and its implementations inside Wizata
A Data Point defines properties of a specific time-series data.
Time-series data
Time-series data or values represents a observation within a sequence of data collected over time. Each message send as time-series typically includes a timestamp and one or more attributes that describe observed data at that particular moment.
Time-series data serve as the foundational elements for monitoring, analyzing, and optimizing industrial processes. They provide real-time insights into machinery performance, production efficiency, and operational conditions, enabling predictive maintenance, enhanced decision-making and improved overall productivity.
Data Point properties
The datapoint itself contains the metadata or properties. The actual time-series data are stored and kept in the time-series data. The association between a datapoint and its time-series data is made through the "Hardware Id".
A datapoint within Data Hub contains metadata and information describing the time-series; e.g. unit, category, type, validity, ranges, ... you can associate labels and extra properties to it.
For example, organizing these datapoints with categories and assigning appropriate units, we enhance our ability to filter the data and easily perform unit conversions, making analysis more effective.
Example
Let's imagine we are monitoring a motor bearing's vibration over time. Each data timestamp in this time-series dataset represents the vibration at a specific moment.
Here's an example from motor bearing dataset for mt1_bearing1 datapoint. Here is its definition:
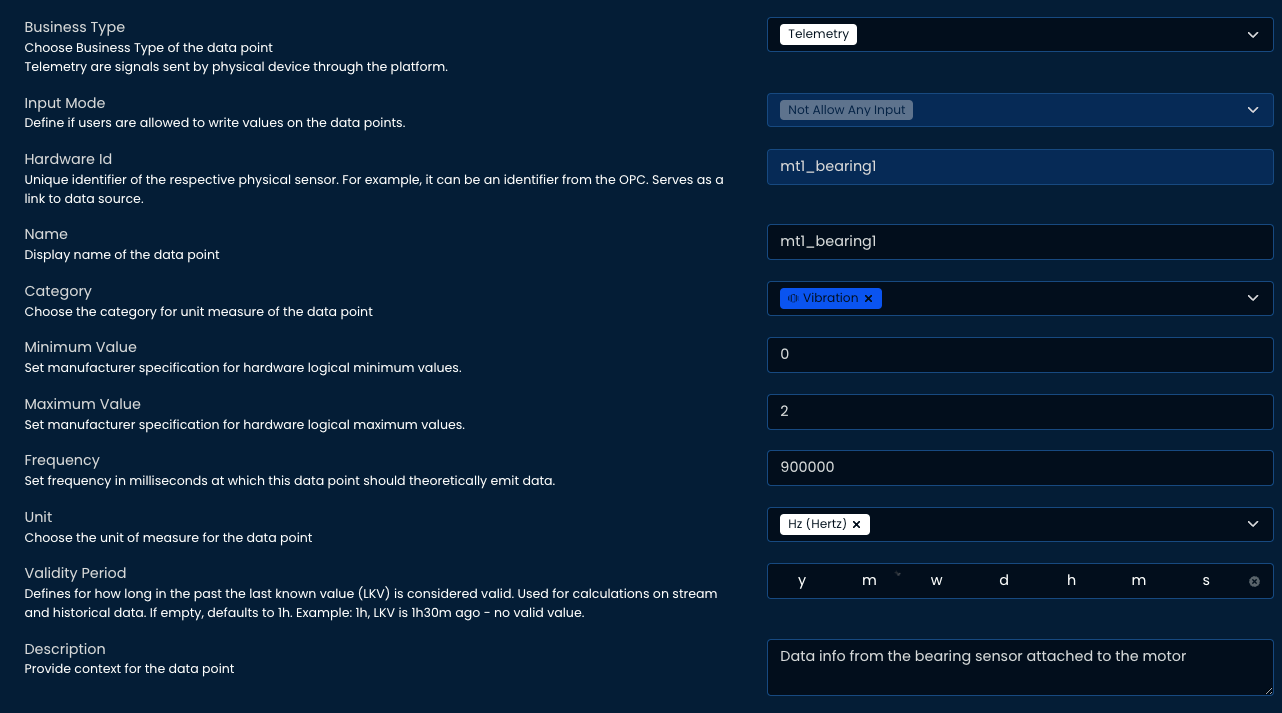
15s vibration measured for mt1_bearing1 in Hertz typically between 0 and 2.
And then time-series data of mt1_bearing1 :
| Timestamp | mt1_bearing1 (N) |
|---|---|
| 2024-08-07 00:00:00+00:00 | 0.0614554421602617 |
| 2024-08-07 00:00:15+00:00 | 0.0614317715708774 |
| 2024-08-07 00:00:30+00:00 | 0.0614081009814932 |
| 2024-08-07 00:00:45+00:00 | 0.061384430392108946 |
| 2024-08-07 00:01:00+00:00 | 0.0613607598027247 |
| 2024-08-07 00:01:15+00:00 | 0.061436776698080925 |
Each row in the table represents a data point. For instance, on August 7th, 2024 at 00:00:00, the vibration of the motor bearing was 0.0614554421602617N.
Connect and/or Import
By uploading data from our sensors and devices into the Wizata Platform, we can transform them into datapoints to monitor and analyze our systems in real-time, optimizing performance and efficiency.
There are multiple ways of uploading your data points to the Wizata Platform, there is a whole article written regarding this, you can find it here.
Updated 9 months ago