Sensor widget
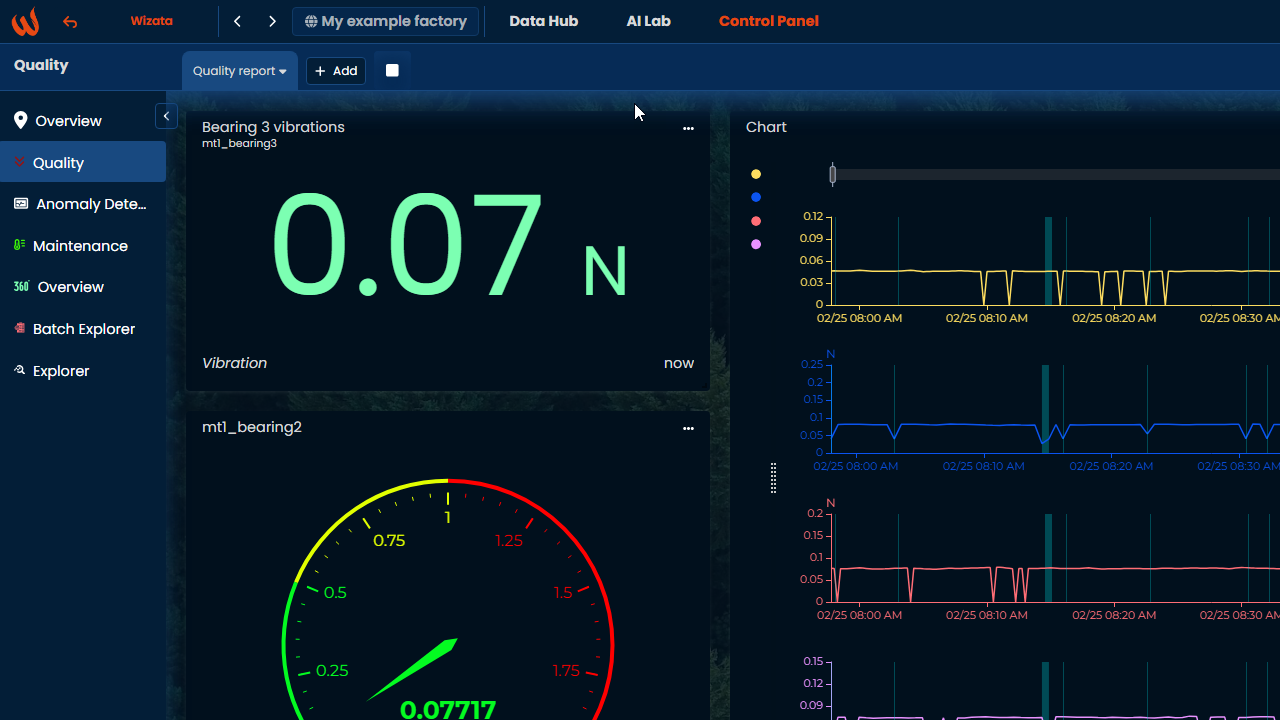
A sensor widget simply displays the last know value of any selected datapoint. This widget is useful to get a direct view on absolute values in live, with possibility to highlight conditions or re-code values to pass the information as fast as possible to whom needs it.
Create the widget
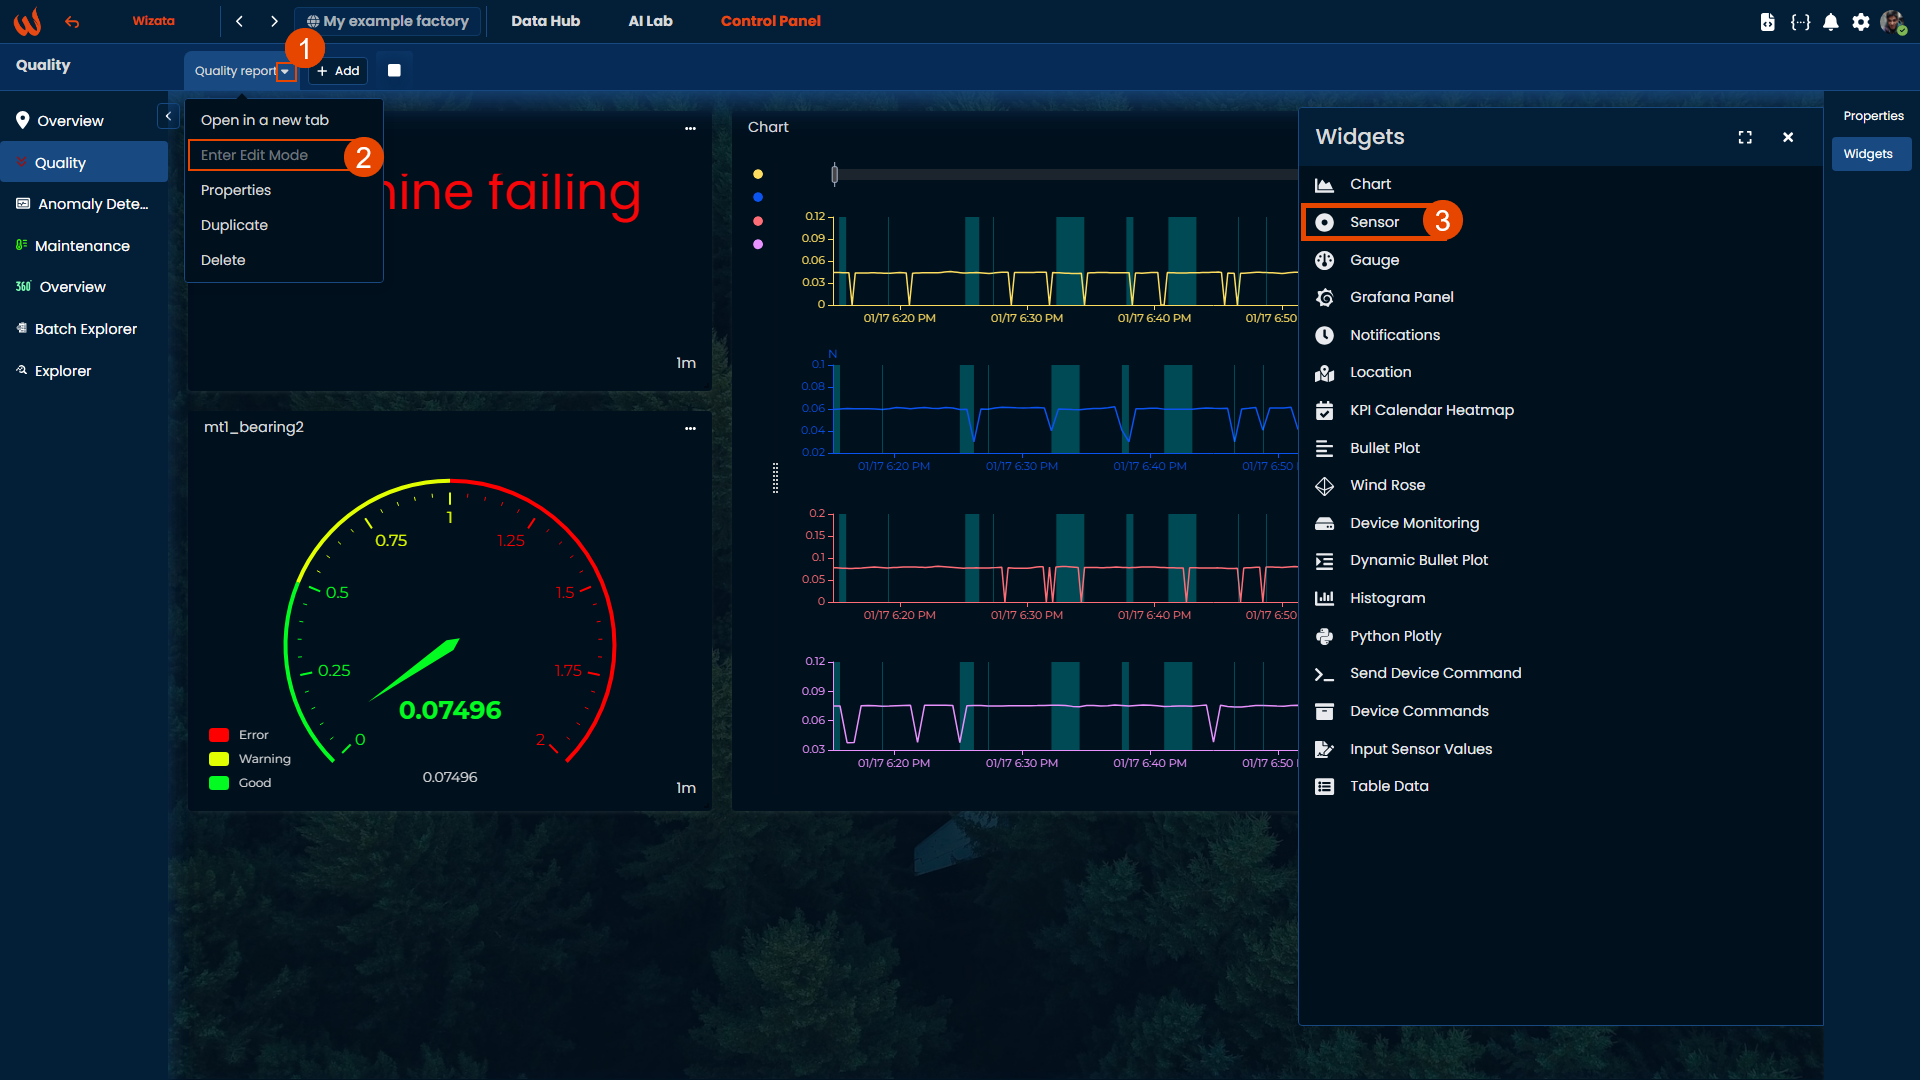
As any other dashboard widget, simply enter "Edit mode", open the widgets menu on the right bar, and select "Sensor". The widget is automatically created at the bottom of the current dashboard.
Configure the widget
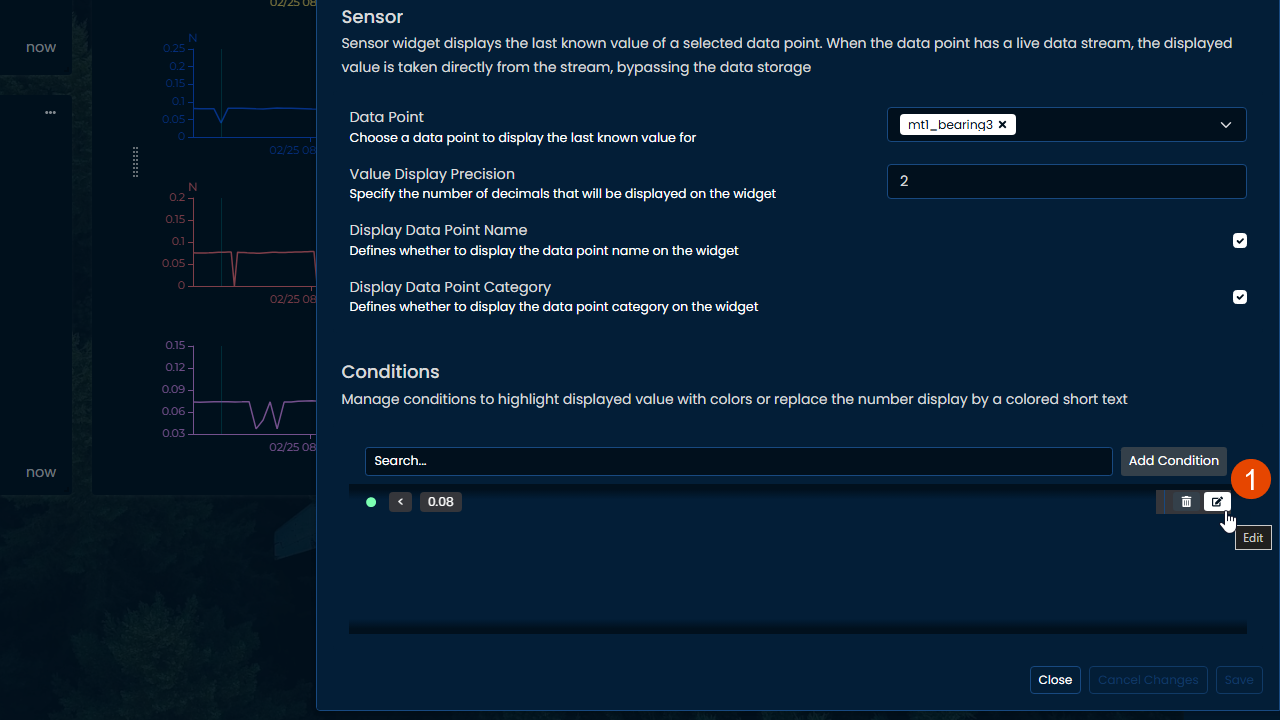
Enter the widget configuration with the 3 dots button on the top right of the widget, and fill the required information to display the datapoint value.
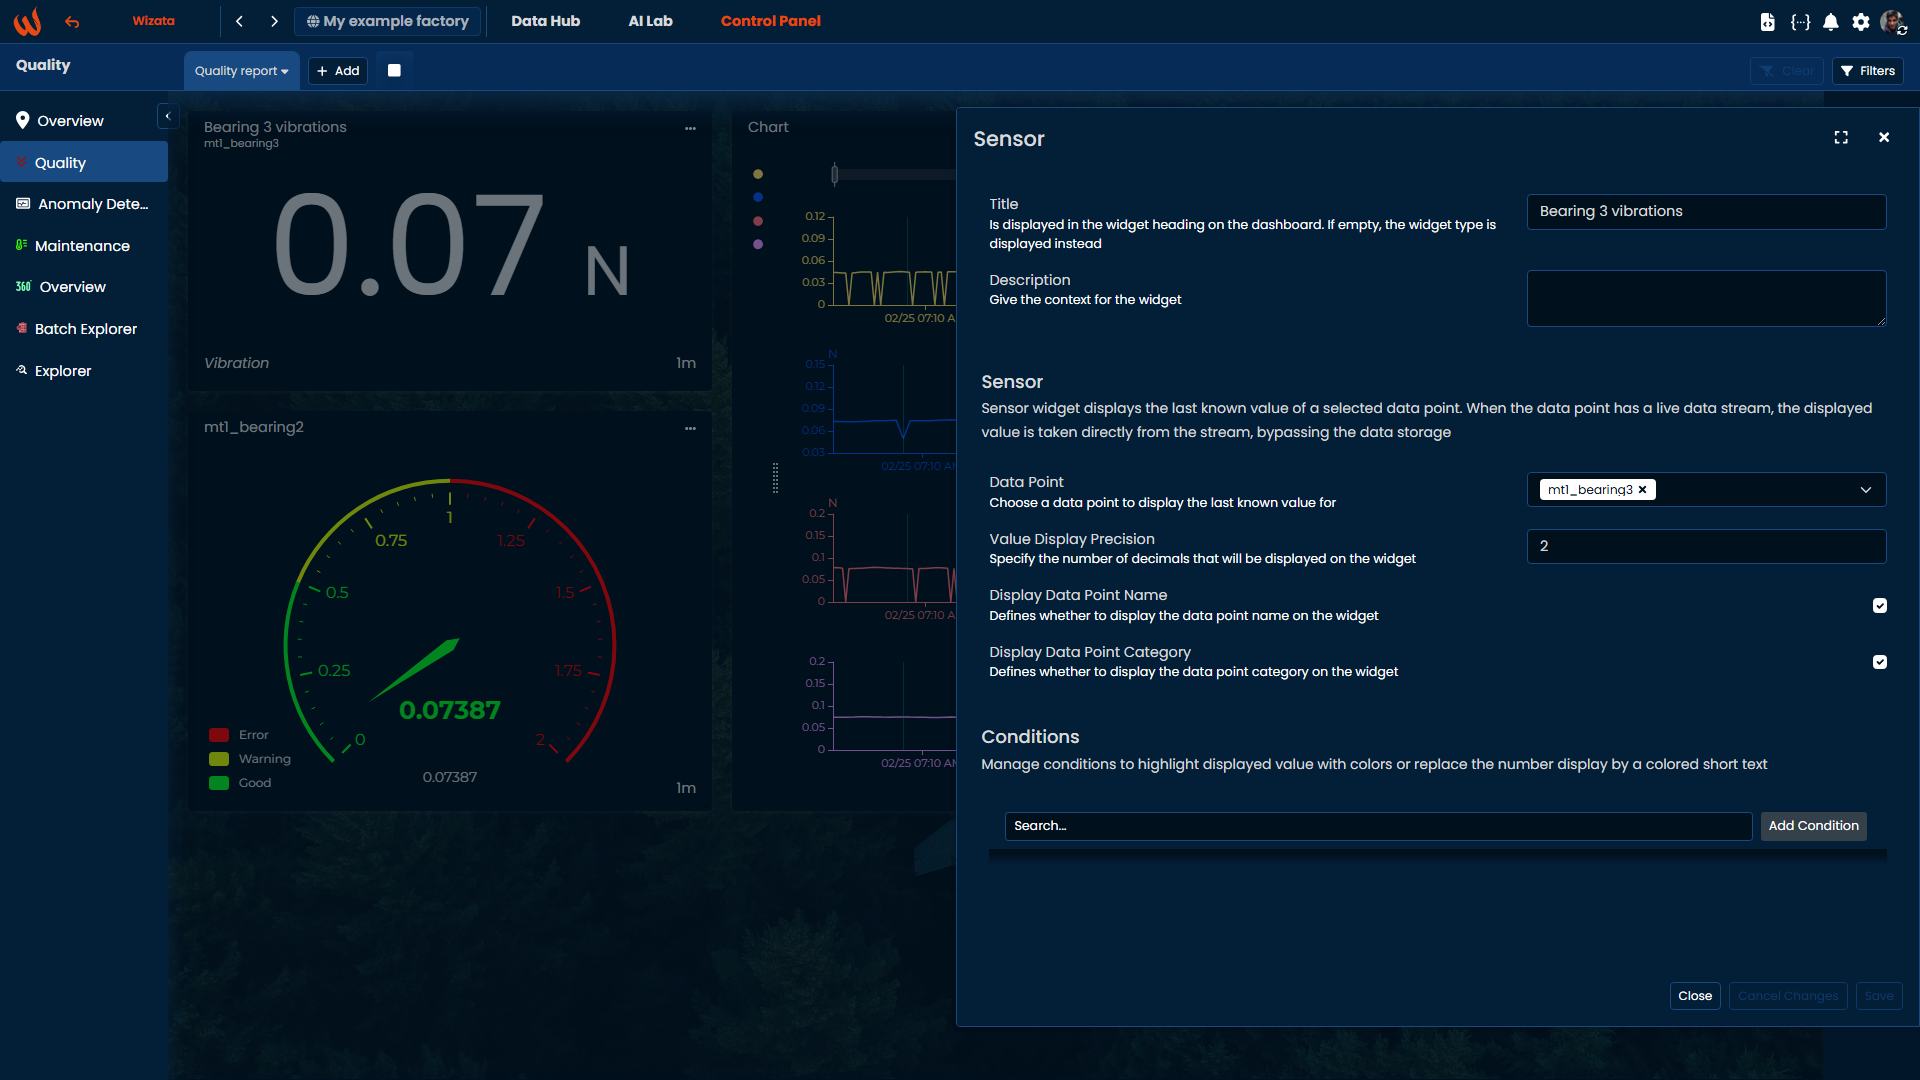
You will visualize the changes on your dashboard after saving the configuration.
Add conditions
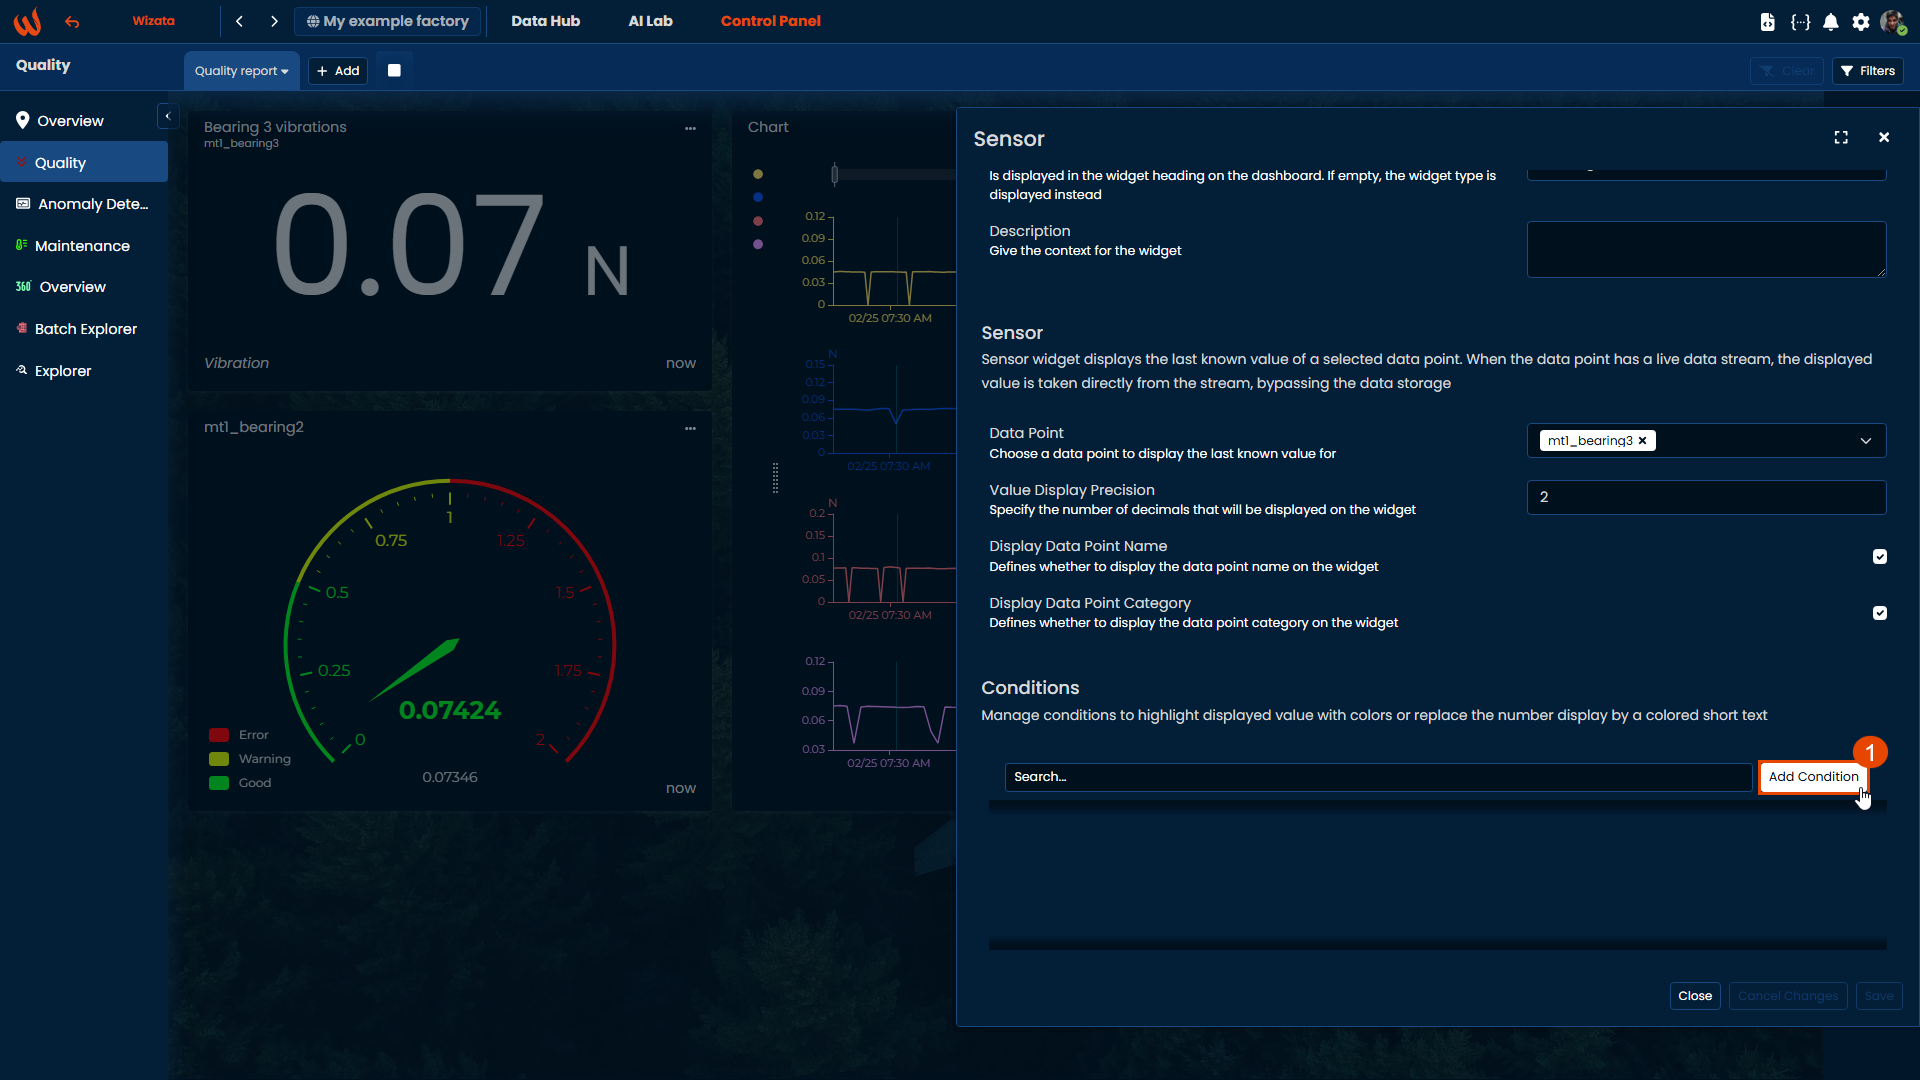
Users can add conditions to change the color of displayed values or recode to other values.
To add a condition, open widget configuration and click on Add condition.
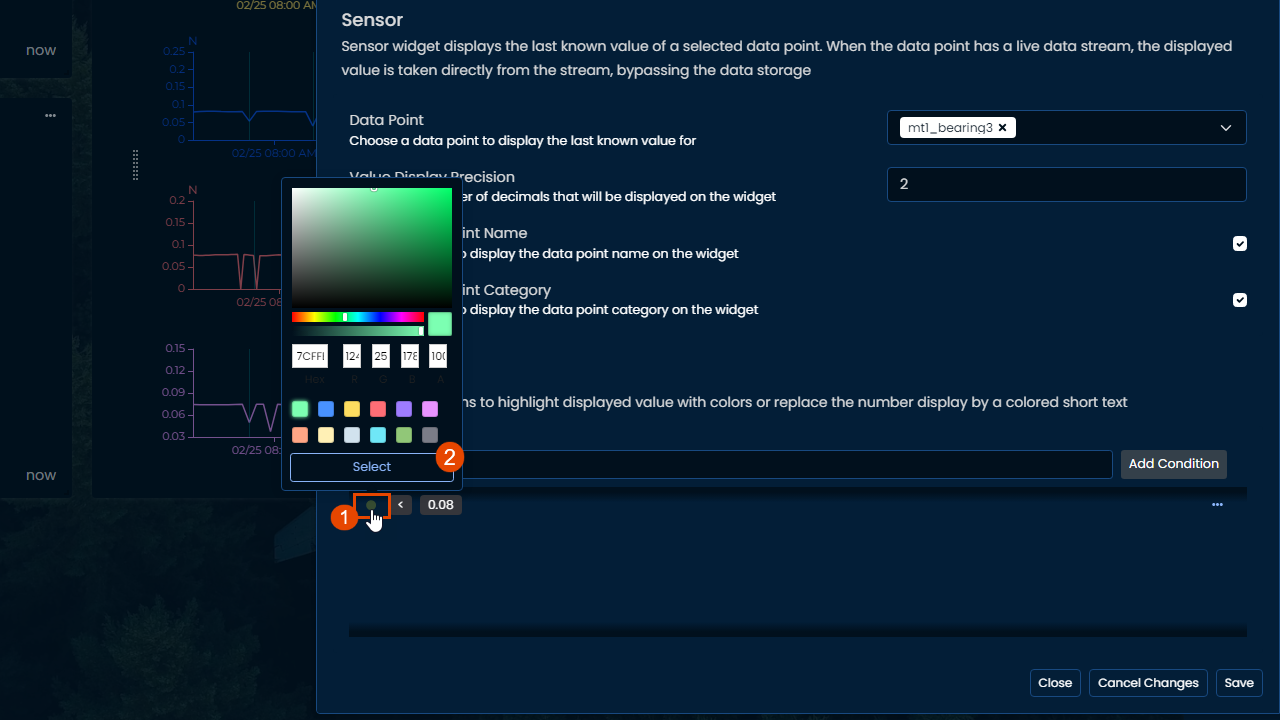
Color condition
As example, vibrations intensity can be mapped to green to indicate they are in their expected range, or red if they are outside.
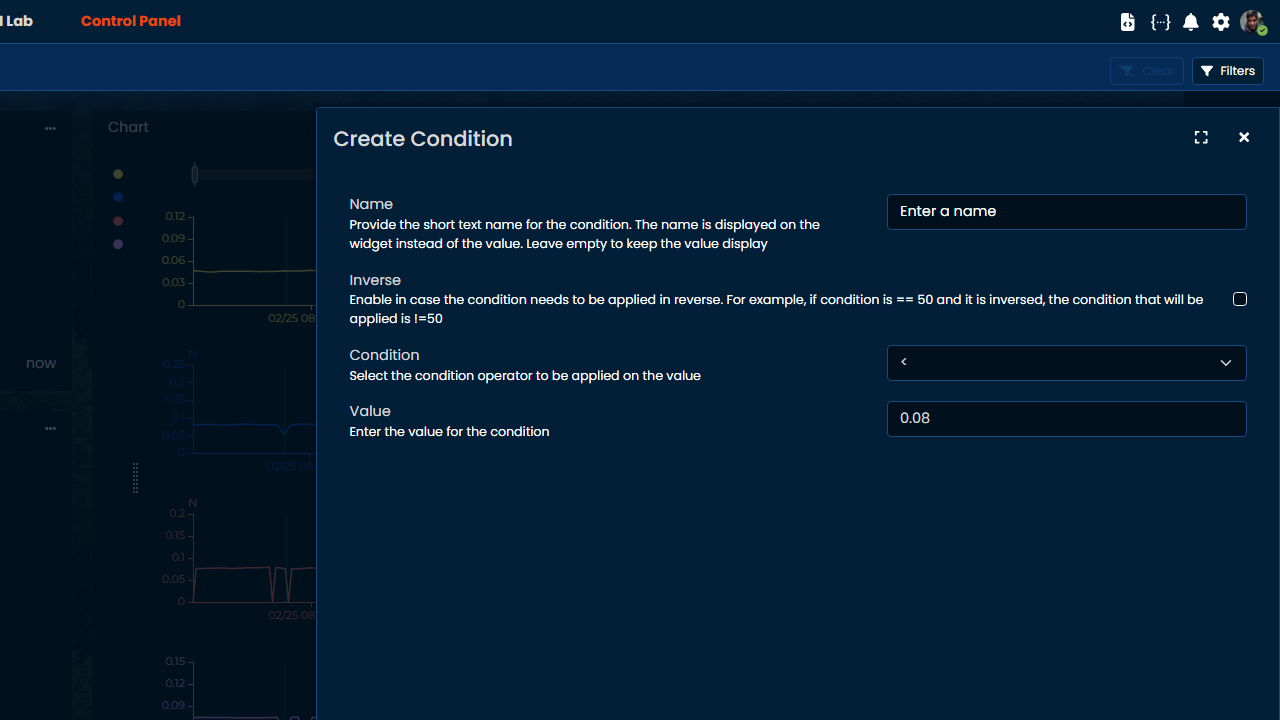
To do that, enter the condition and threshold value value, and leave the "Name" field empty.
Once save, pick the desired color for this condition by clicking on the condition color box. Don't forget to click on select to apply the color, and save the widget.
The value is colored according to the defined threshold and values.
Text condition
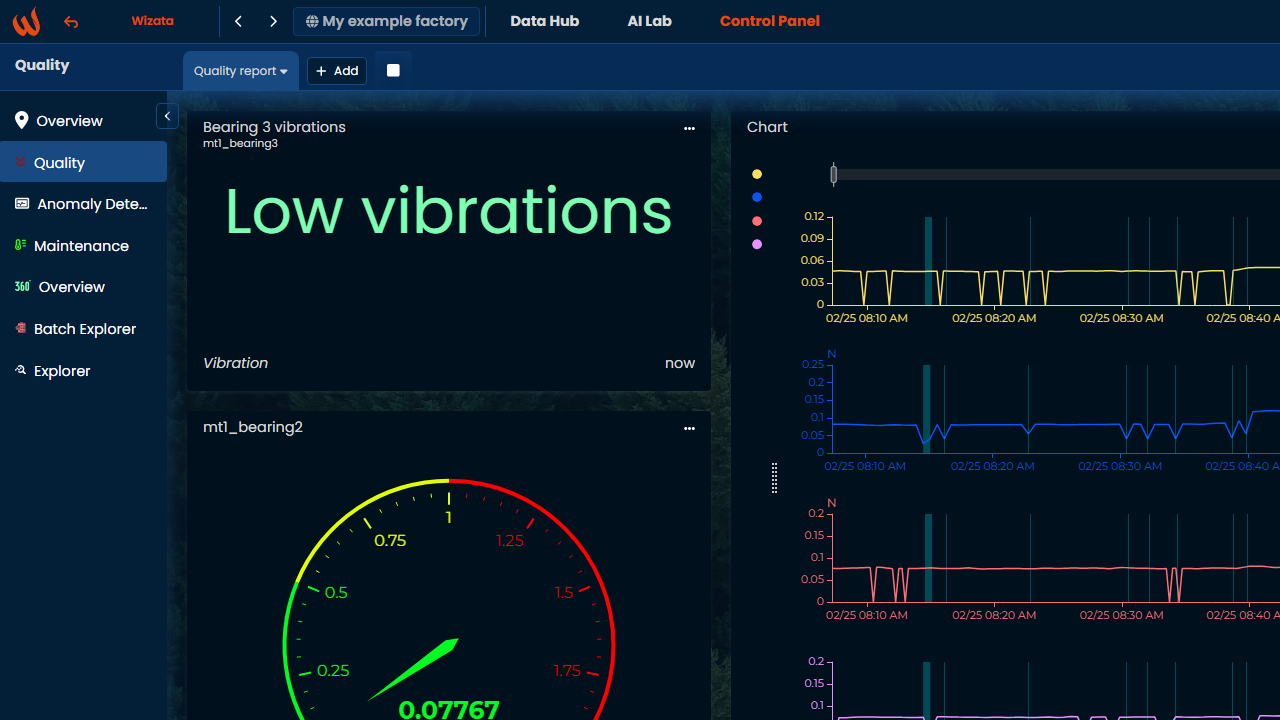
In the condition configuration, if a new value is defined in the "Name" field, the datapoint value will be overriden by this new value. For example, vibrations measure can be replaced by a text label like "Low vibrations" or "Status OK".
To do that, you can create a new condition or edit and existing one with the appropriate button.
And then enter a text label or value to override the datapoint value on the widget when the condition is filled.
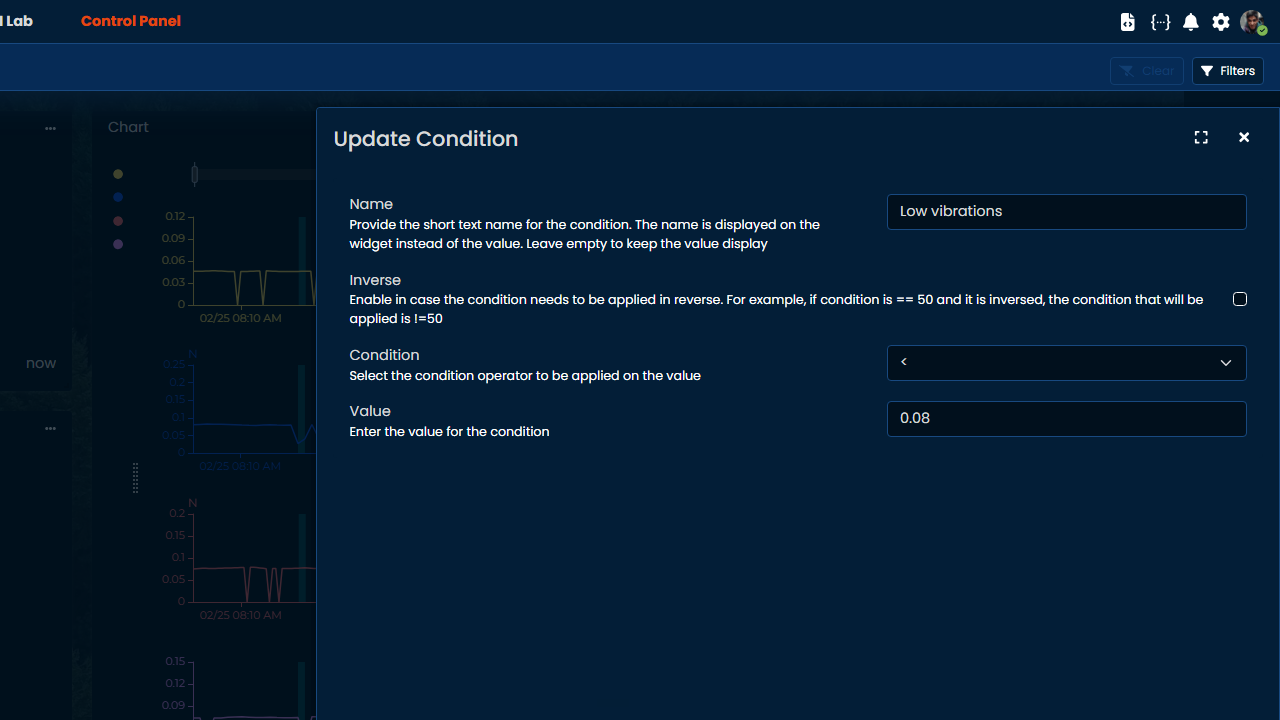
Saving this new condition will render the following result:
Updated 9 months ago