Query data from Wizata within Grafana
As mentioned in the previous article, we also offer the ability to integrate our custom Wizata plugin into Grafana to meet your specific needs. The Data Query option within the plugin is a powerful tool that will allow you to retrieve data directly from your Data Points in the platform, to visualize it in your Grafana graphs and dashboards.
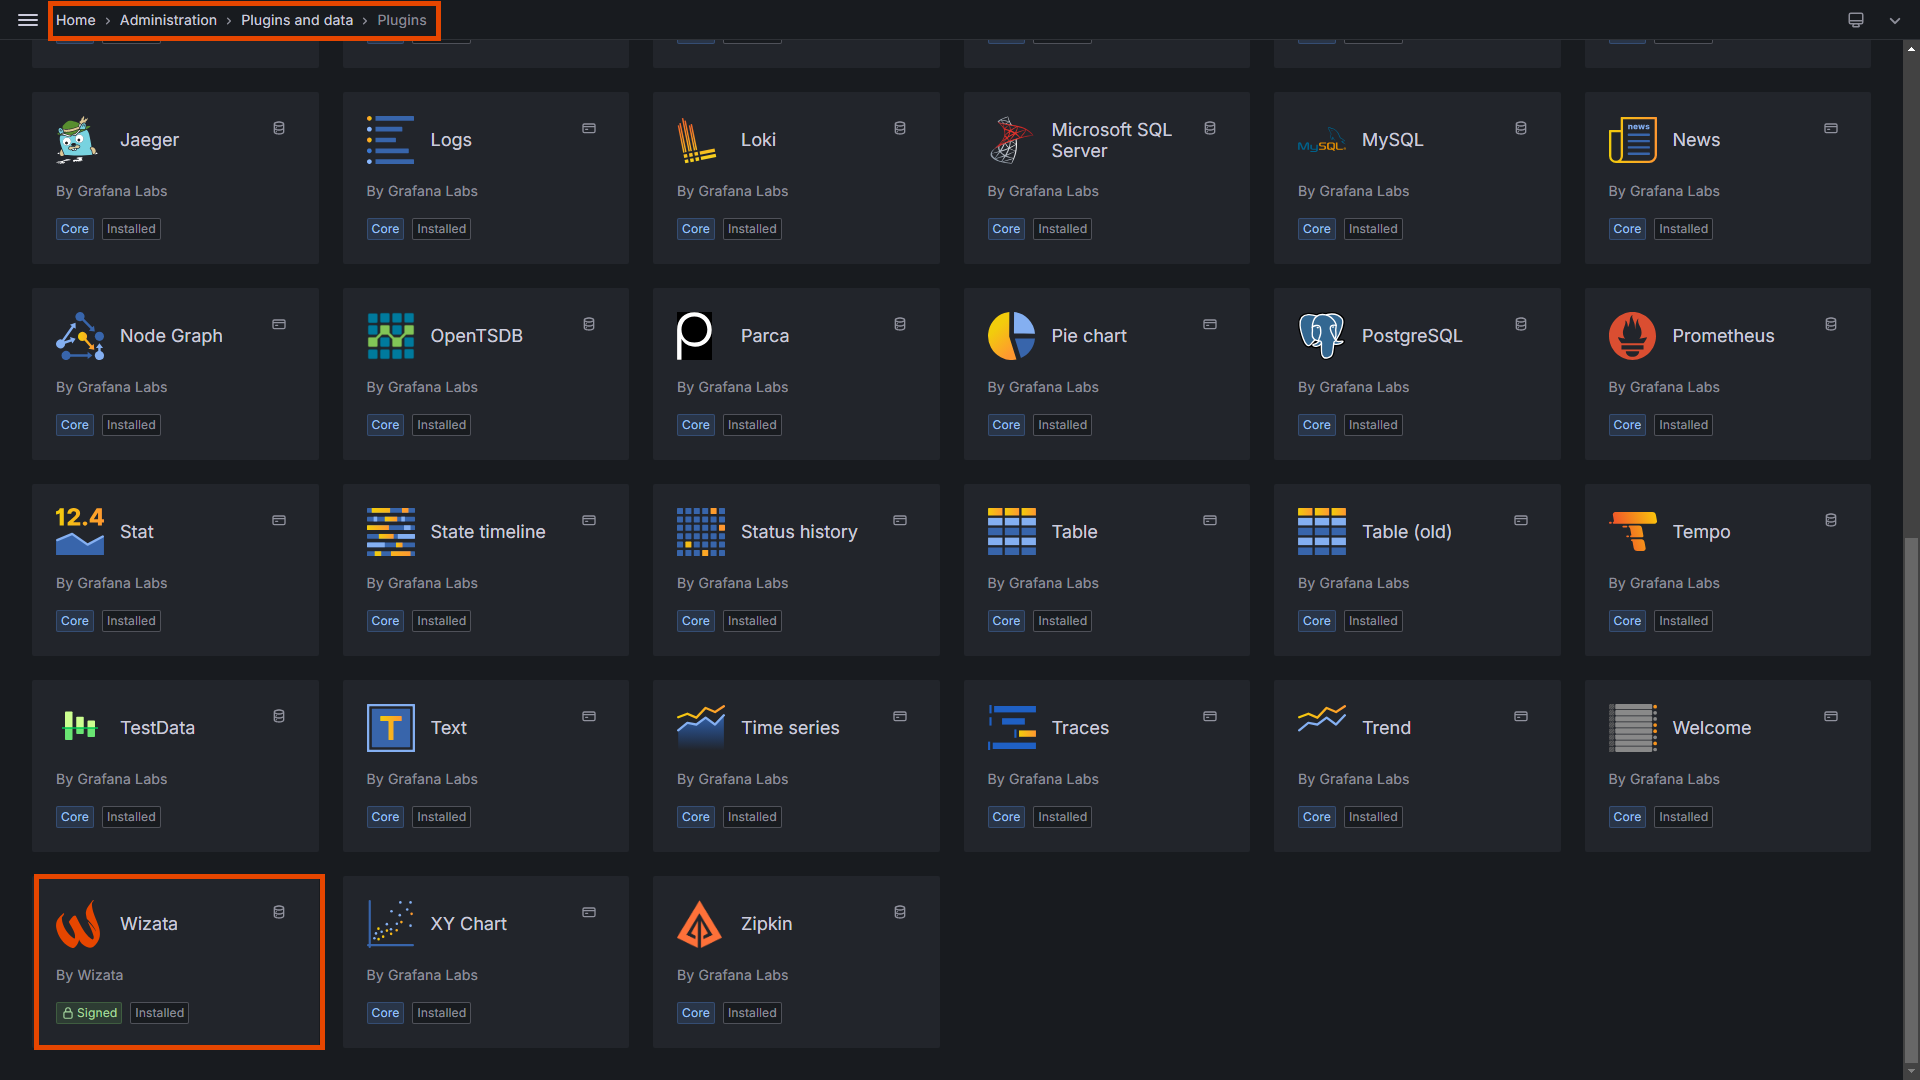
Once installed in your Grafana environment, Wizata signed plugin will appear in the list of available plugins inside Plugins and data section, already configured with your credentials, ready to be used.
To start creating our first Data Query data source, we will click on Wizata from the list of options, and go to Add new data source, complete the configuration with the Query type option marked on Data Query. and clicking on Save and test blue button.
Exploring Query Data plugin options
In the Explore section, you can start querying data from the platform and create your own graphs to be exported to your Grafana dashboards.
For this example, we will create a graph using the motor's bearing1 data from the sample data file provided in the Connect article, with a 60-second interval between each Data Point. After selecting the desired options, click on Run query to display the results both as a Graph and as a Table at the bottom of the page, as shown in the image below:
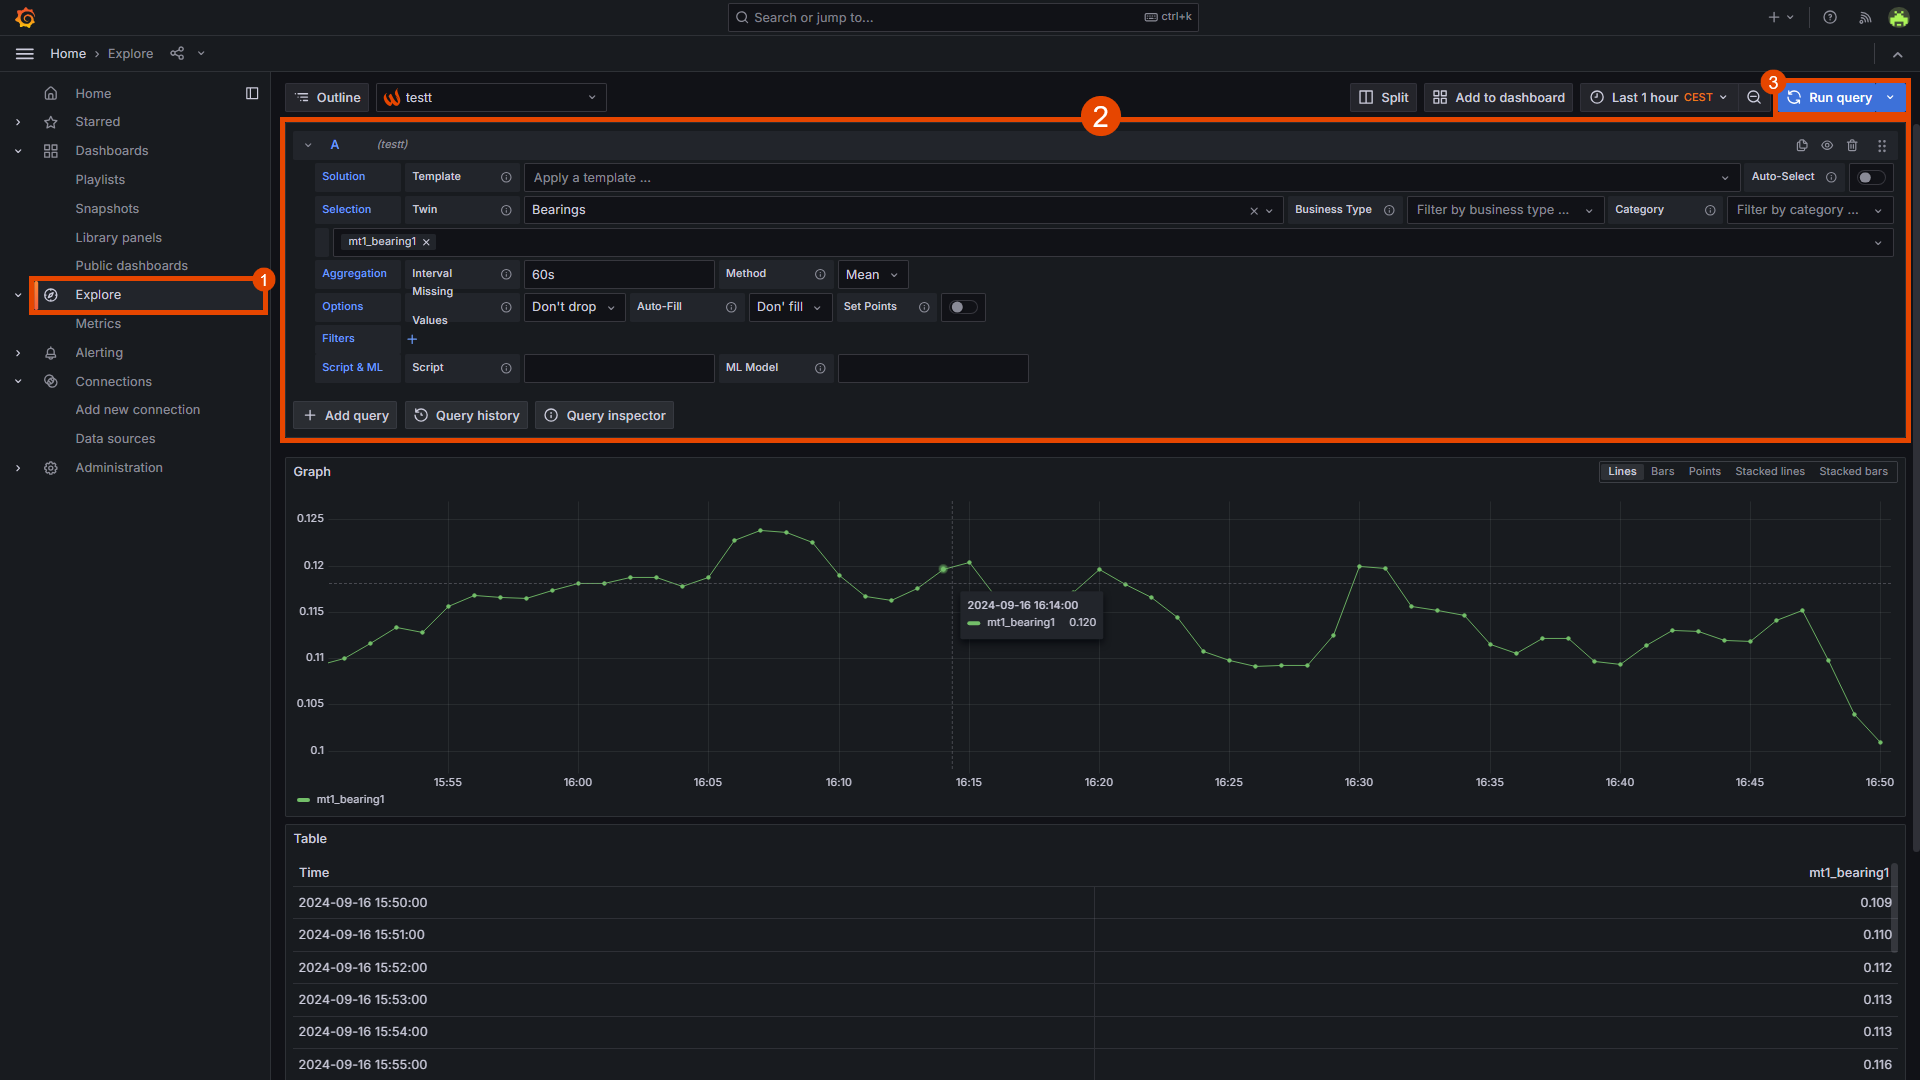
At the top right of the Graph section, you can change the graph type from the default
Linesto another style that suits your needs.
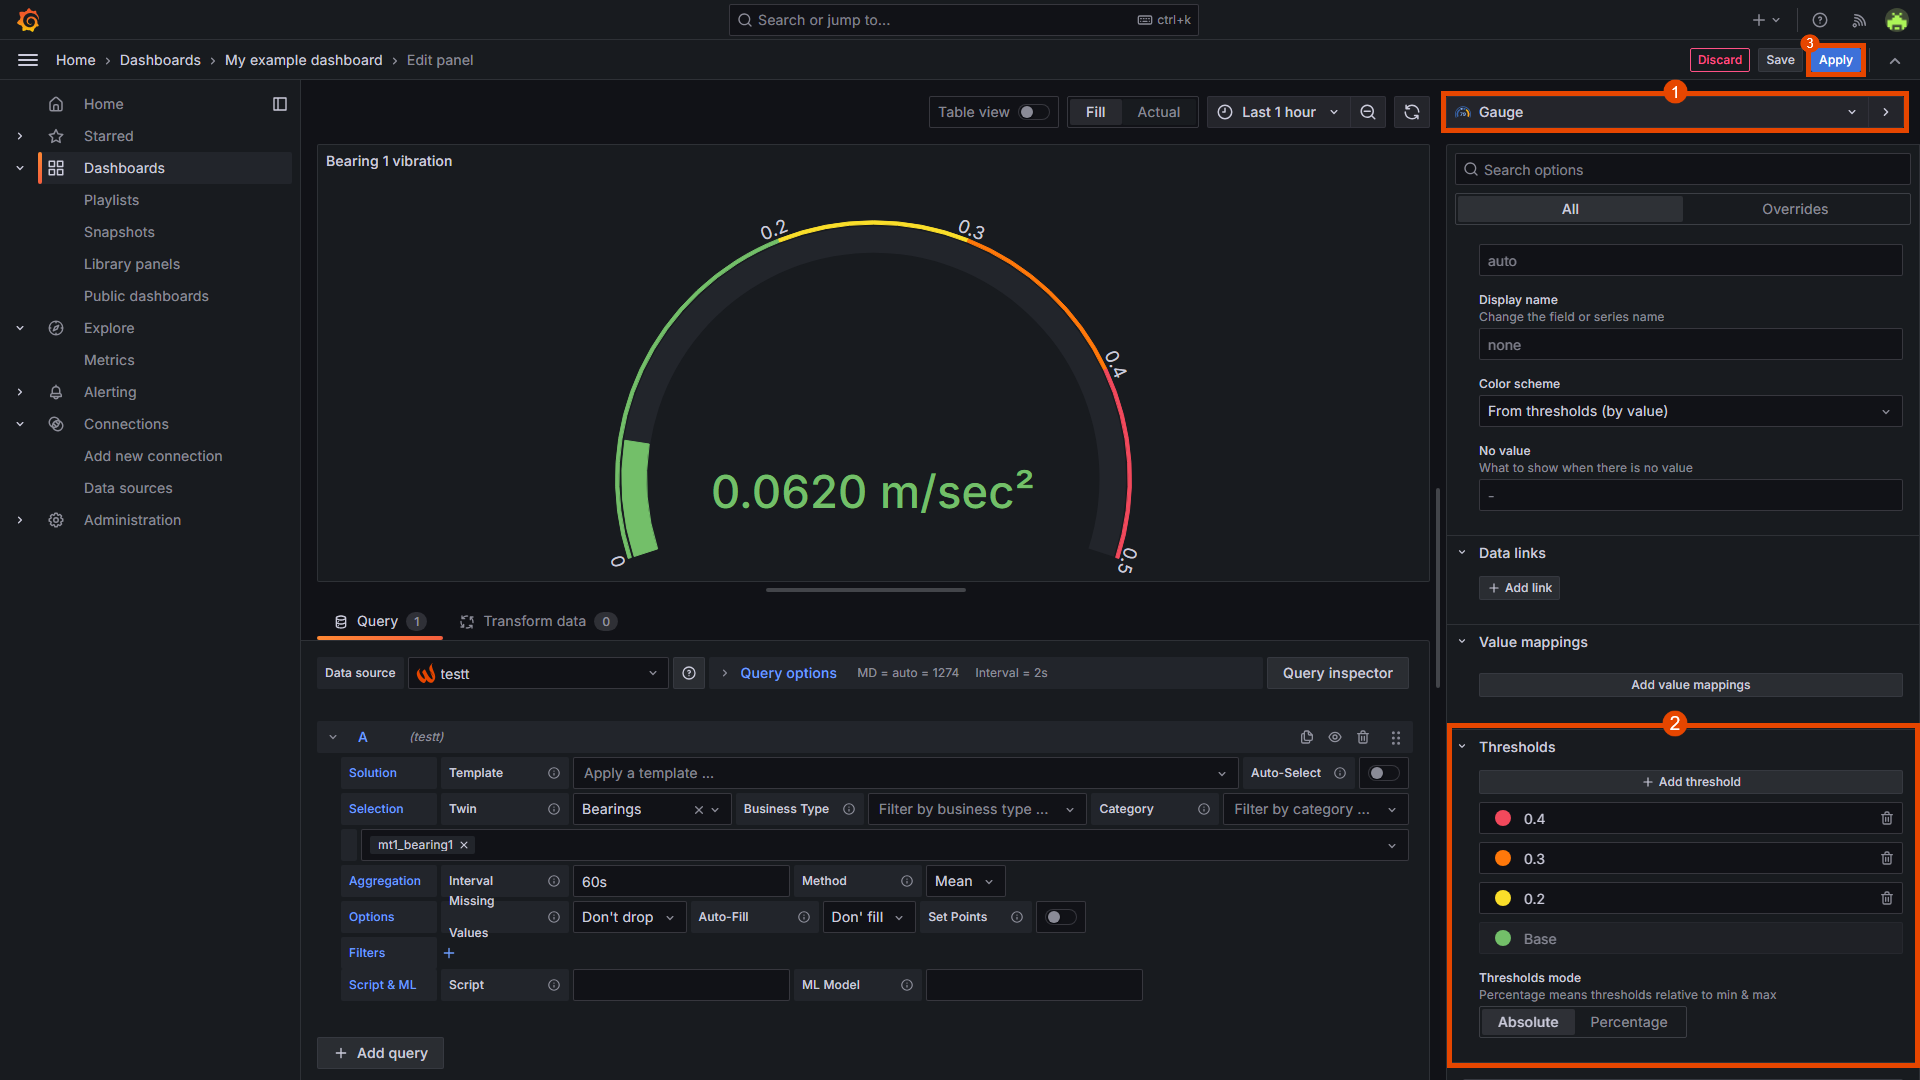
Clicking on Add to dashboard will either export your graph to a new dashboard or copy it to an existing one. You can start making editions by clicking on ...-> Edit or by pressing the letter e on your keyboard.
In the top-right corner of the screen, you can customize your graph by switching between the various widget types available. For this example, we will select the gaugeoption, configuring it with the appropriate measurement unit and setting different thresholds:
Using Query Data plugin in a custom dashboard
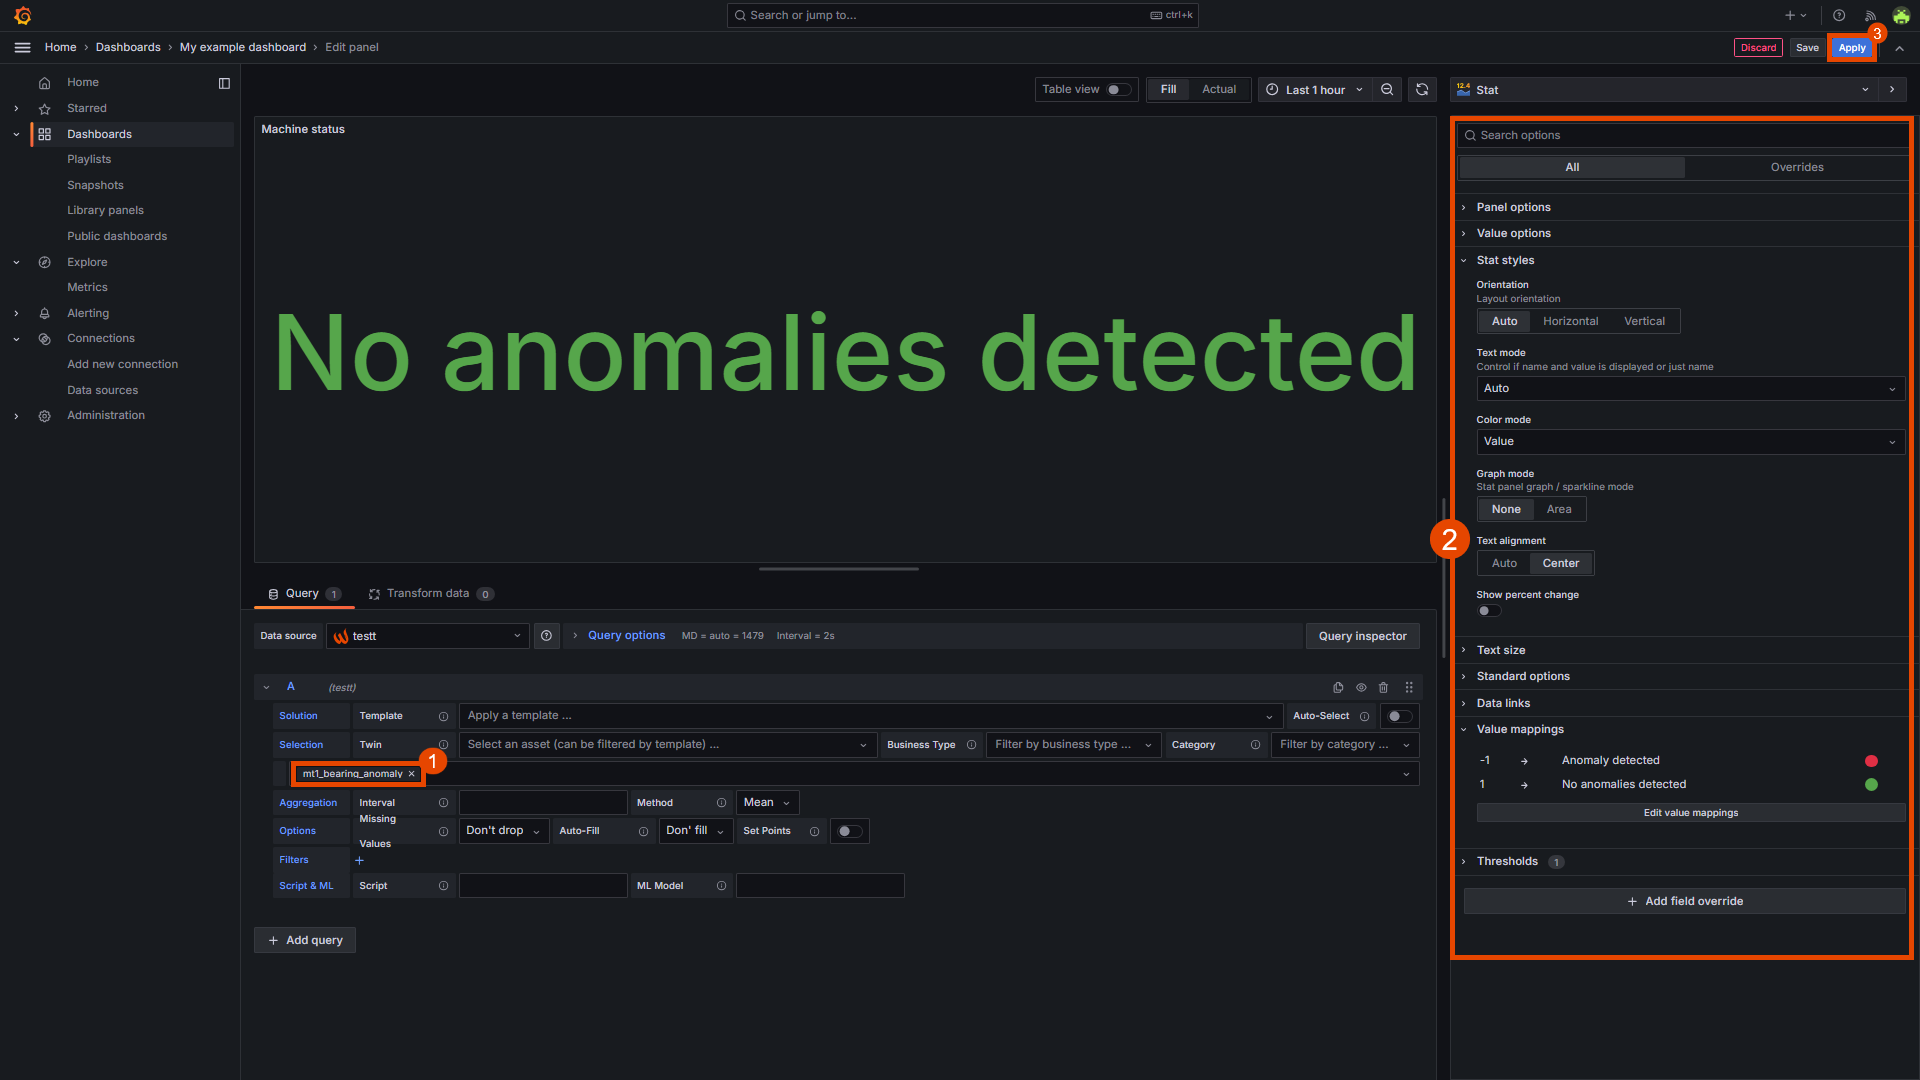
Now, we will prepare our first Grafana dashboard with the corresponding graphs to be exported to the platform. We will begin by replicating the template from the previous section for each bearing. Additionally, we will create a widget to display the results from the Anomaly Detection tutorial that was previously built using the sample bearing data.
For this case, we will utilize the mt1_bearing_anomaly datapoint, which stores the results of the anomaly detection. In the left panel, we will add a value mapping condition that will display Anomaly detected when the datapoint value changes to -1 (indicating an anomaly in the pipeline Execution)
For the next step, in the following article we will create an interactive panel that allows you to run a pipeline directly from the dashboard, featuring customizable variables and instantly displayed results.
Updated 9 months ago