Plot step
A Plot step generates a Plotly figure from a Python script or a built-in plot generator. Plot steps are only executed during experiment mode by default. Automatic background executions will skip any Plot step unless execution_options has plot set to True.
A Plot step functions similarly to a Script step, with one key difference: it cannot produce a dataframe output. Its purpose is purely to visualize data during experimentation so you can inspect and validate the results of your pipeline before deploying it to production.
Plot types
The Plot step supports two types of plot generators:
- Custom plot scripts: Python functions you write and register on the platform using Plotly. These give you full control over the visualization logic. Refer to the Script step article for details on how to create and register scripts.
- Built-in plot generators: predefined visualizations provided by the Wizata library, available for common use cases such as anomaly detection charts, trend plots, and data summaries. For more details, refer to the Wizata library for common functions.
Adding a Plot Step
Using the Pipeline UI, navigate to Library > Plot Generators in the left-hand panel. You can filter by Custom or Built-in generators. Drag the desired plot generator onto the canvas and connect the input dataframe block. No output block is needed since Plot steps do not produce dataframe outputs.
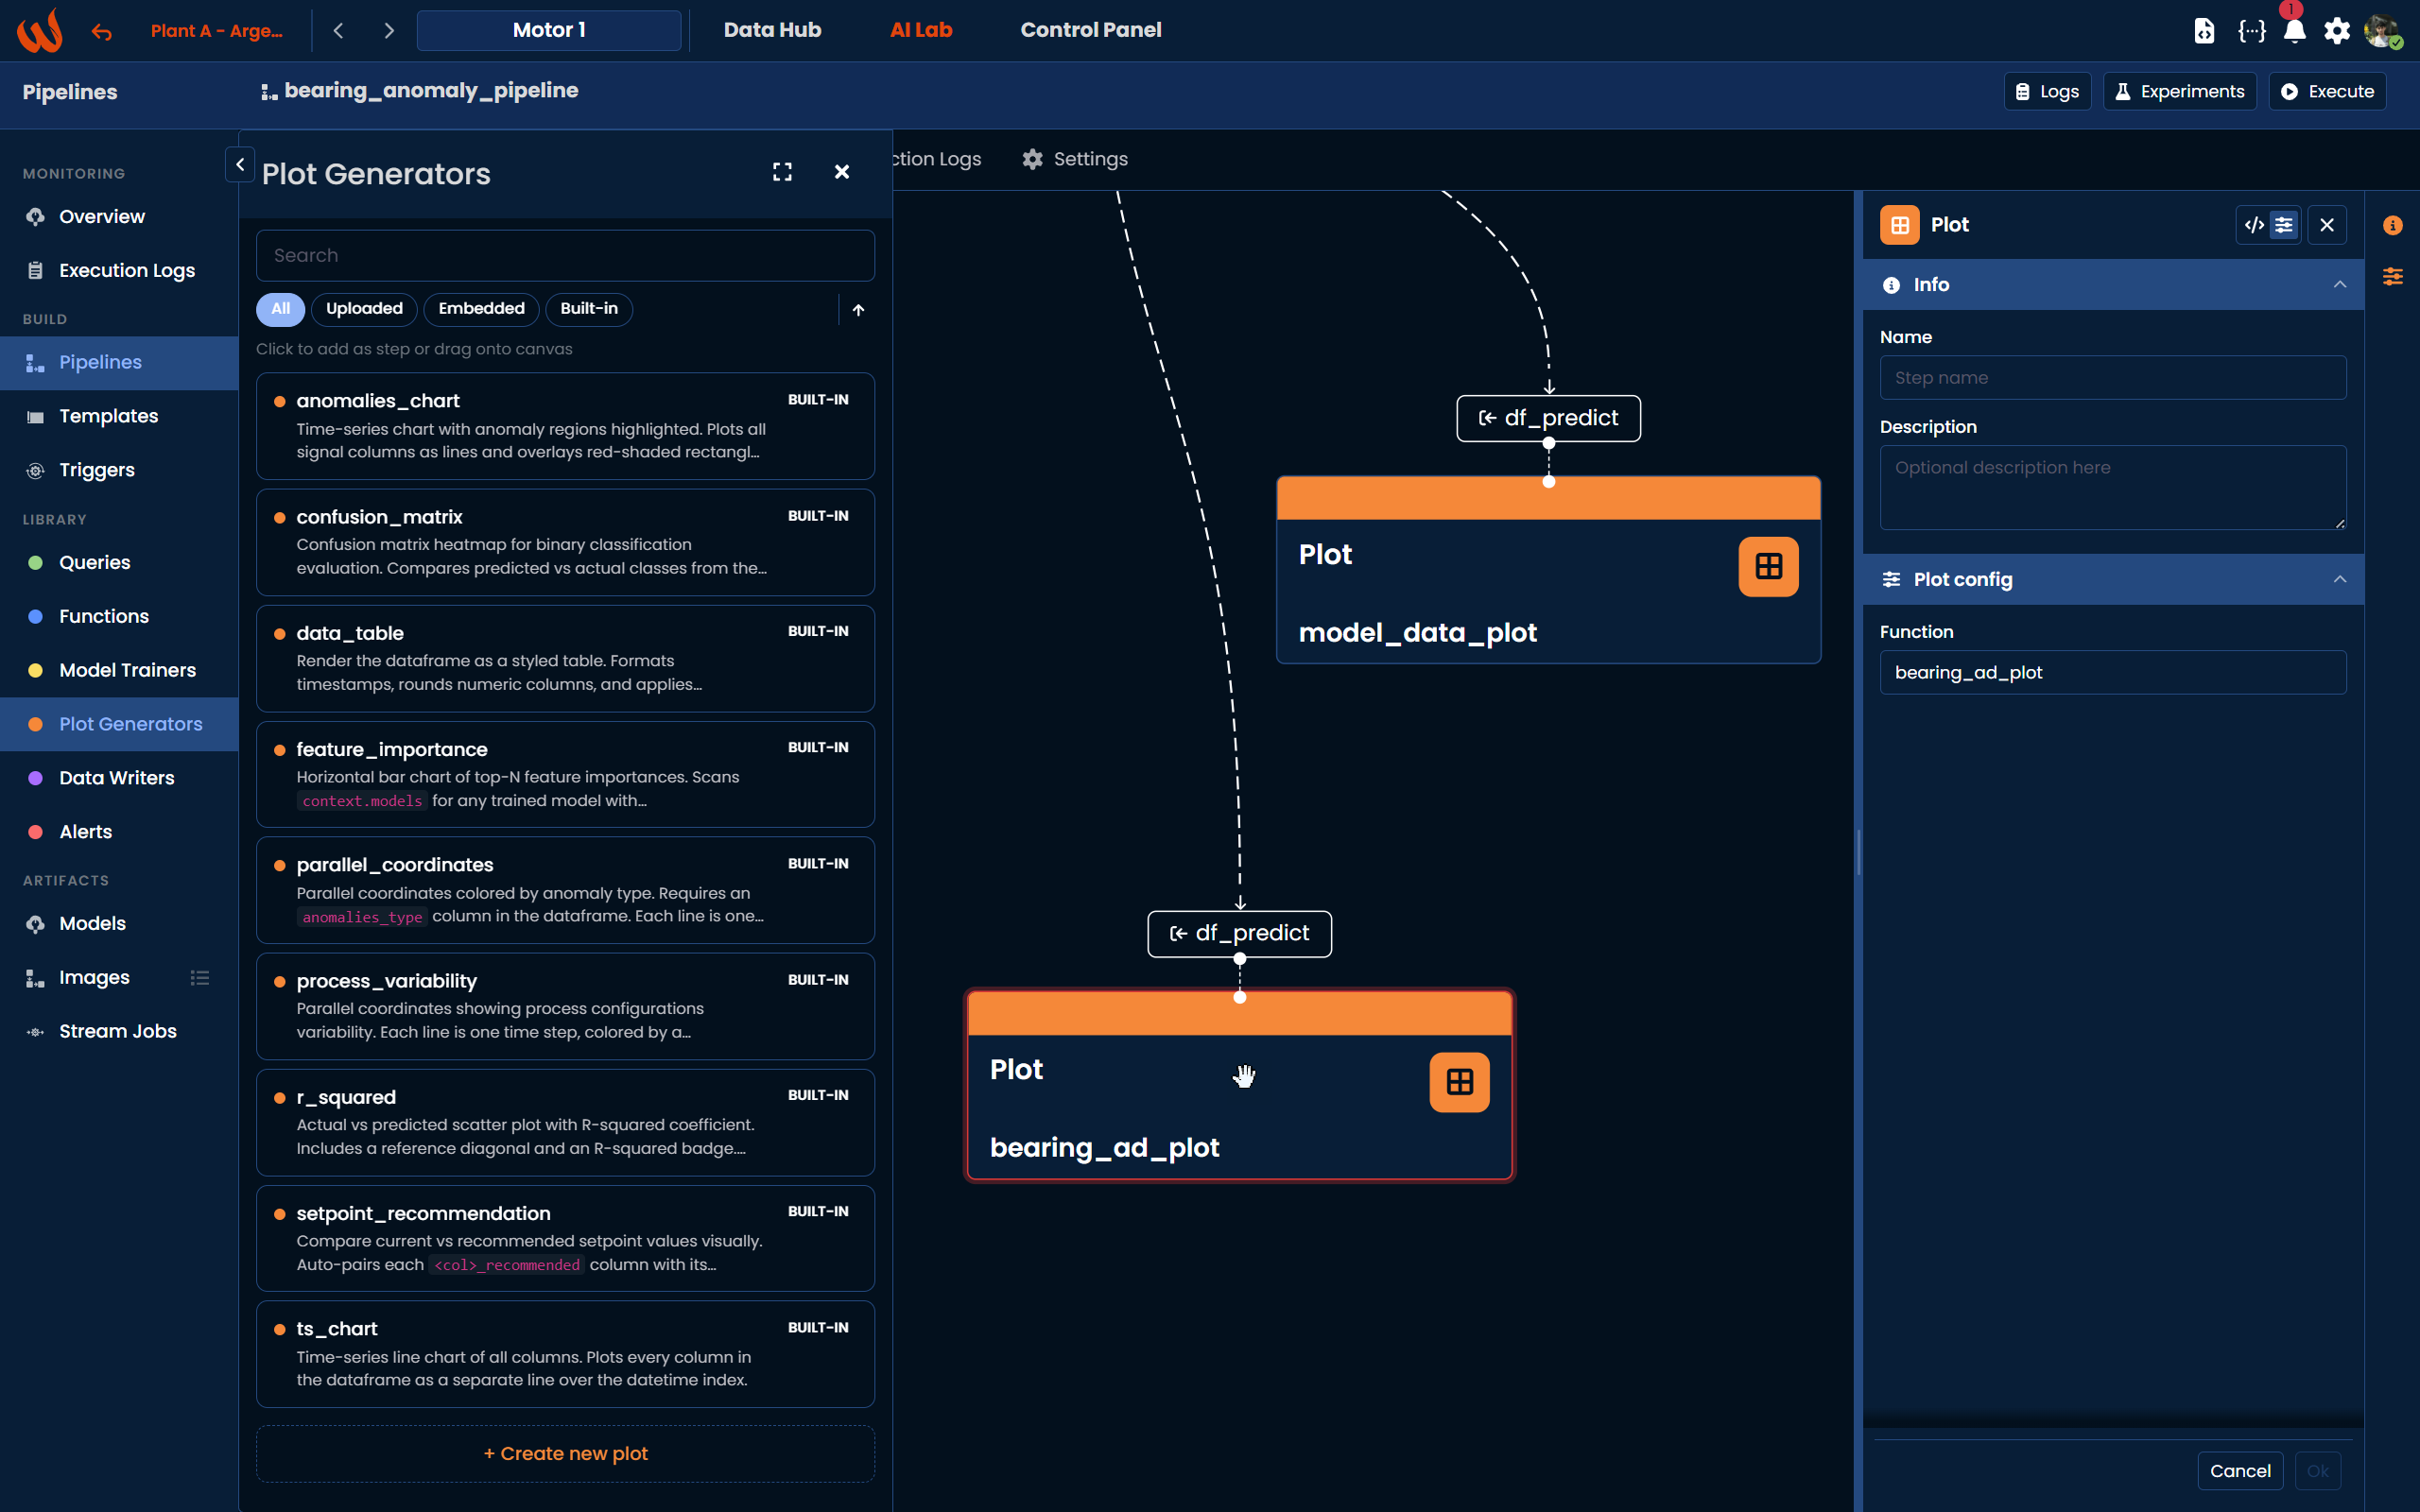
Using the Python Toolkit, add the plot step to the pipeline using pipeline.add_plot():
pipeline.add_plot(
    df_name="df_predict",
    script="bearing_ad_plot"
)
To use a built-in plot generator, reference it directly by its library key:
pipeline.add_plot(
df_name="df_predict",
script="wizata.plots.anomalies_chart"
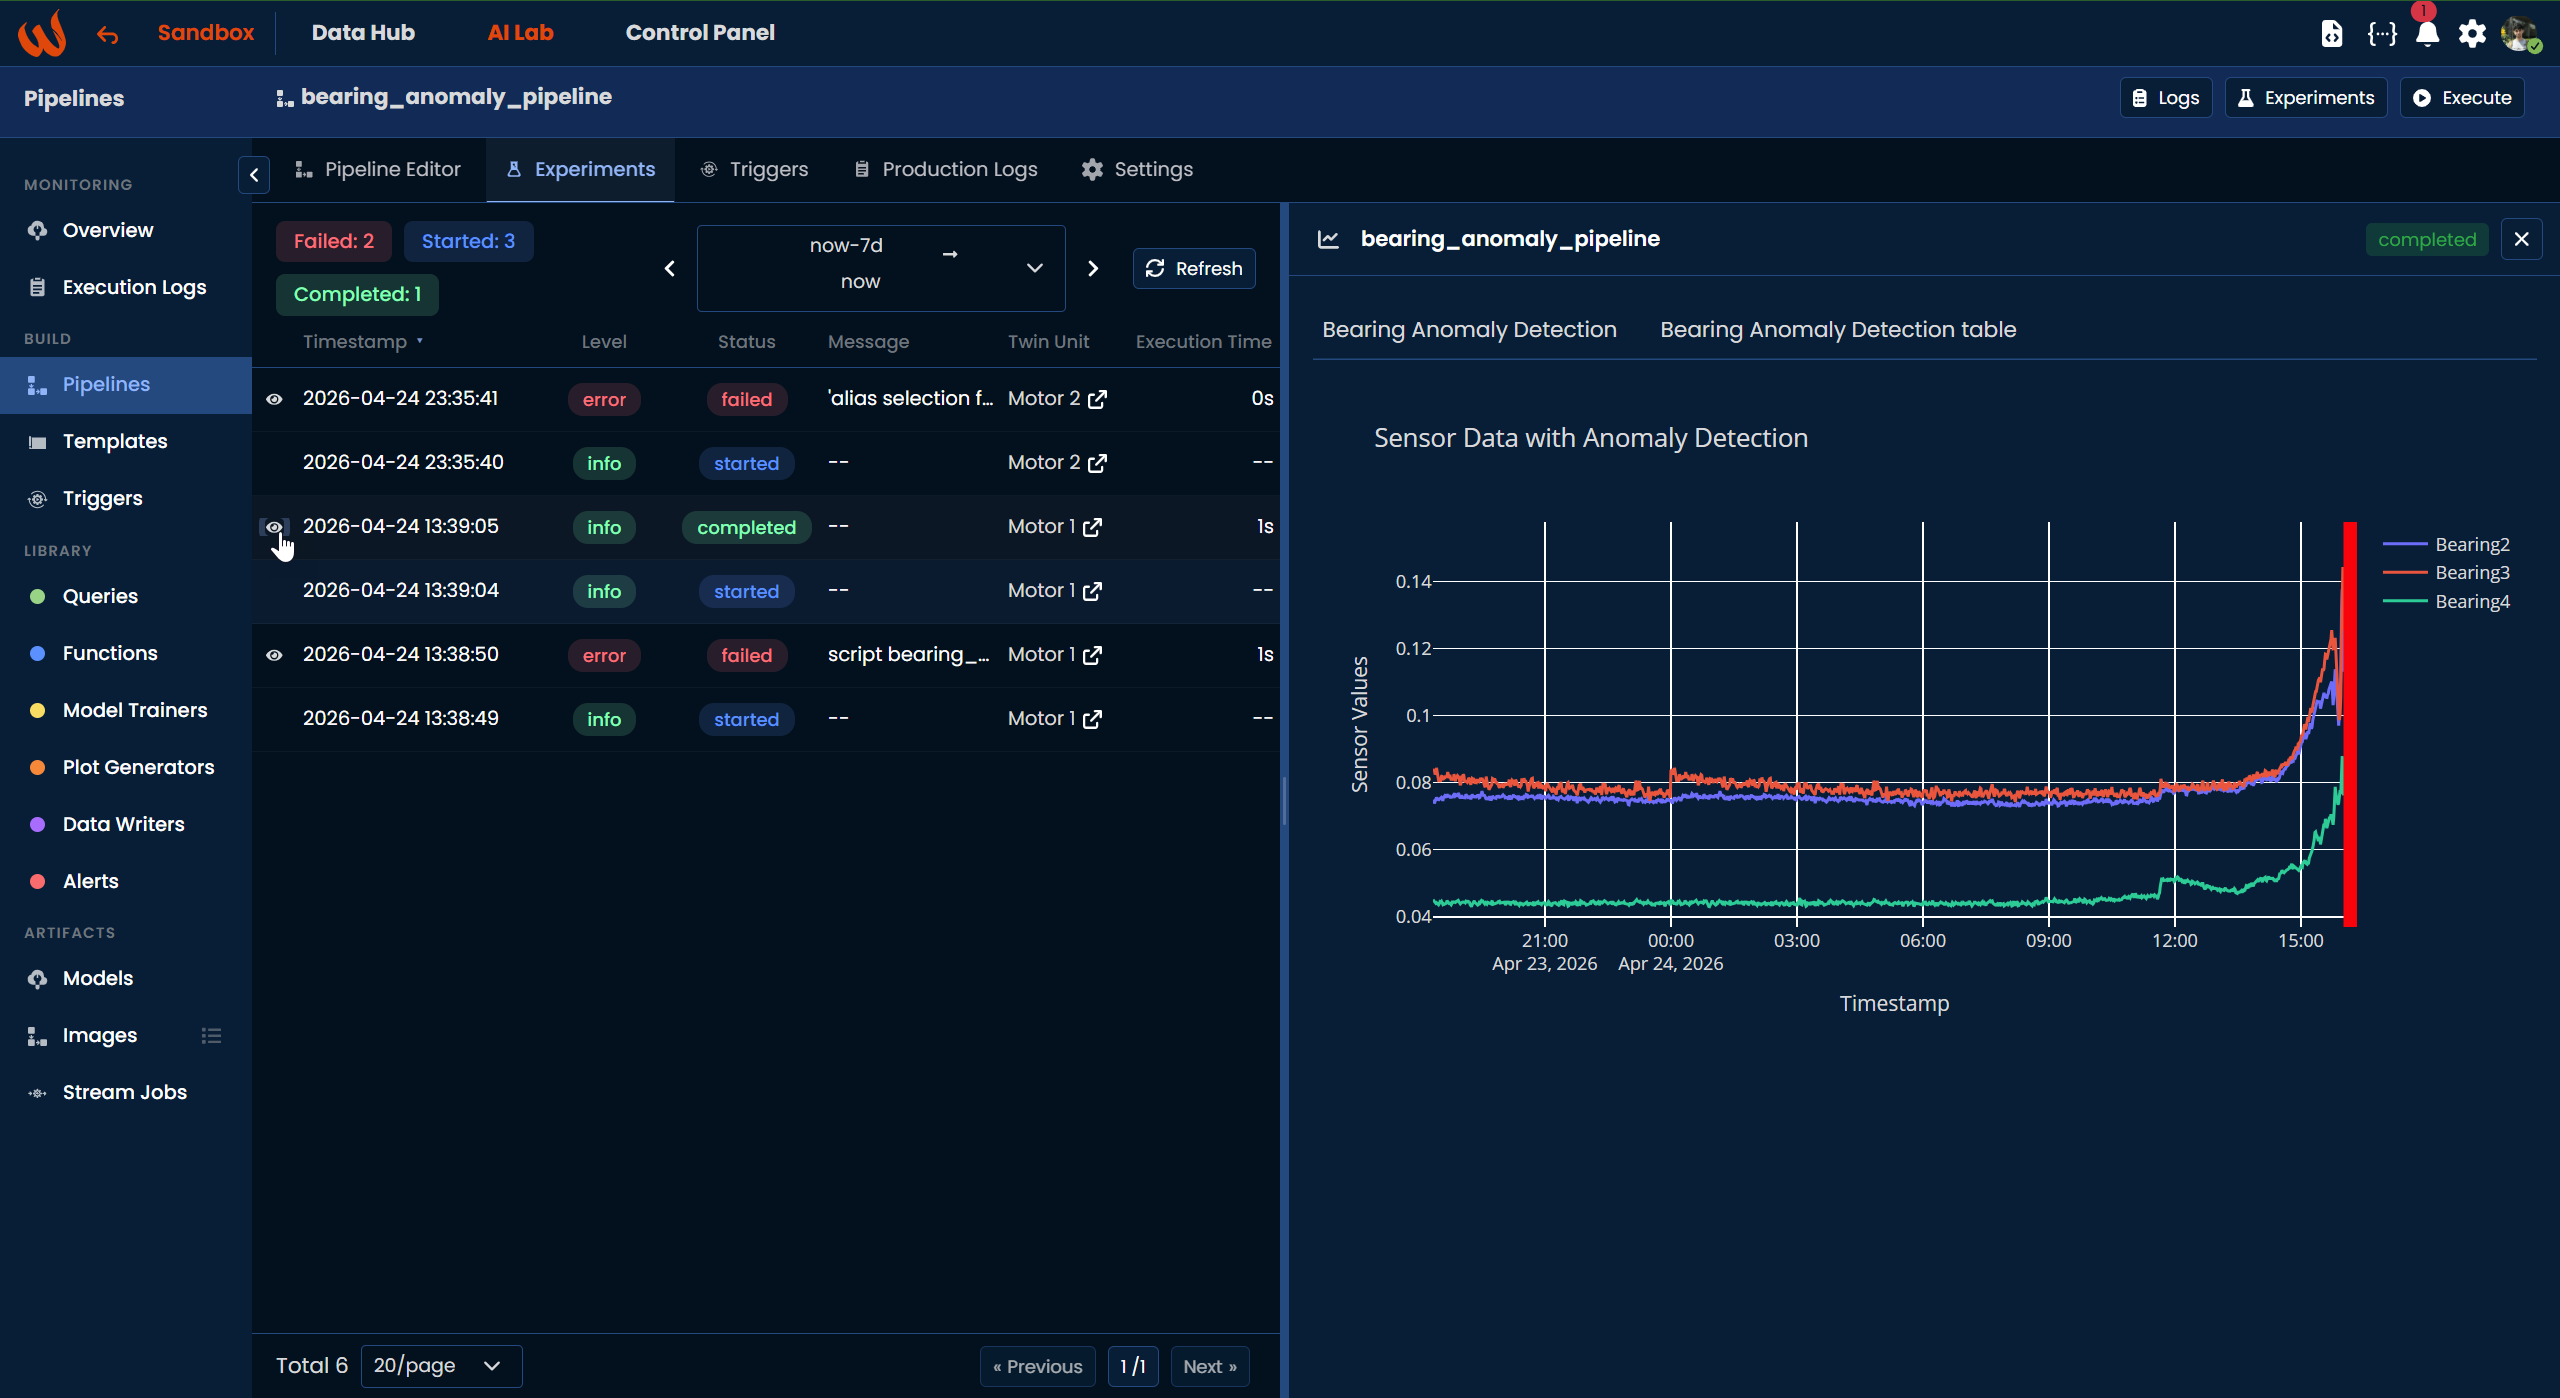
)Viewing Plot Results
Once you run the pipeline in experiment mode, the generated plots are available in the Experiments tab. Click the eye icon next to a completed execution to open the experiment detail panel, where all plots produced by the pipeline will be displayed.
JSON Format
Here is an example of a Plot step configuration:
{
  "type": "plot",
  "config": {
    "function": "describe_df"
  },
  "inputs": [
    { "dataframe": "sum_dataframe" }
  ]
}
The config follows the same structure as a Script step and supports features_mapping and properties_mapping in the same way. The input dataframe named in inputs will be passed to the plot function at execution time.
Updated 3 months ago