What is the Control Panel?
Introduction to control panel section and capabilities
The Control Panel is the central hub of our application, designed to empower users with comprehensive tools for visualizing, monitoring, and analyzing manufacturing production data.
It serves as the command center where users can access a suite of interactive dashboards and detailed reports, providing real-time insights into every aspect of the production process.
Whether you are a plant manager, production supervisor, or data analyst, the Control Panel offers a customizable interface tailored to meet your specific needs, ensuring that critical information is always at your fingertips.
Navigation
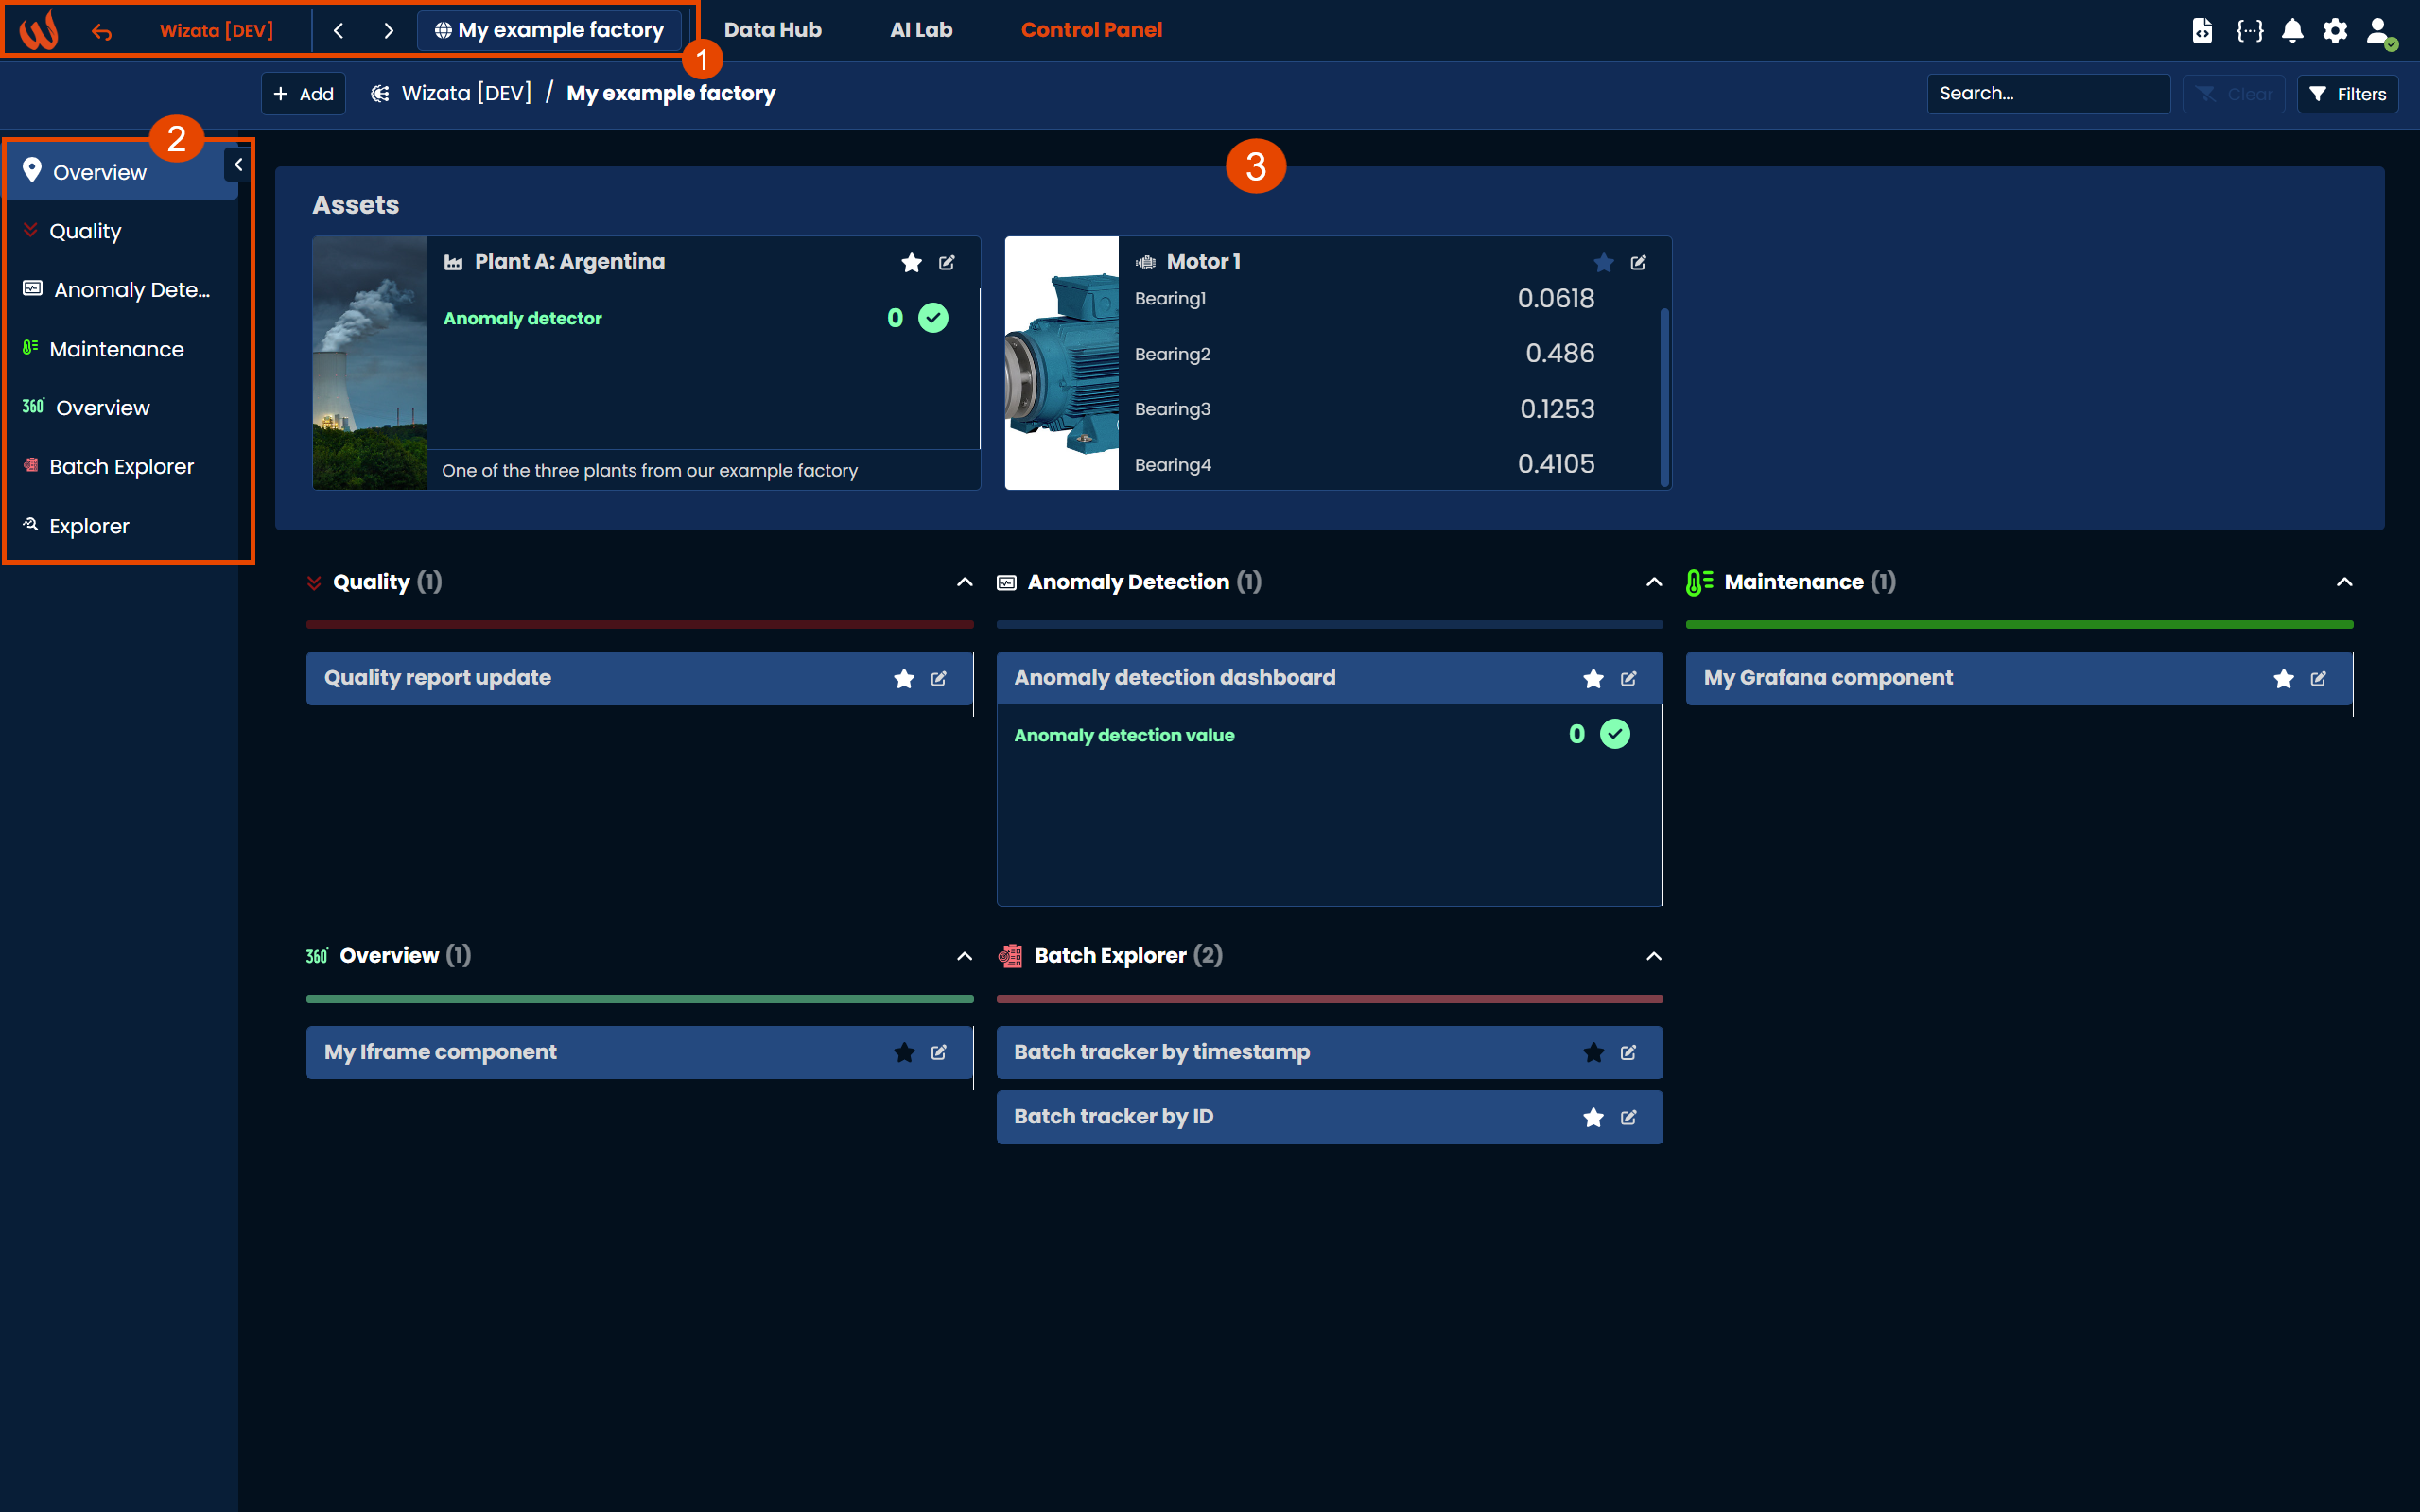
To facilitate navigation between the different assets and solutions, different tools are available to ease the navigation:
- the Twin Selector helps navigate the asset structure from global organization view to specific equipment.
- the Business Labels allows you to categorize your components and content on meaningful categories for your business : e.g. quality, maintenance, operation, ...
- the Overview will gave you a quick access to all content, insights and components underneath the currently selected assets.
To learn more about this feature, we invite you to read the Navigation article.
You can link users to specific assets and twins in order to restrict their view and content to some assets for more focus and straightforward access.
Insights and Data exploration
The Control Panel allows for deep historical analysis where users can access and easily analyze live and historical production data to identify long-term trends, compare performance over time, and inform strategic planning.
Insights allow us to display real-time data from our datapoints directly on an asset or component tile. By attaching multiple insights to a component, you can quickly access precise information about key processes
Furthermore, Insights can also trigger dynamic information in our asset's & component's tiles with defined conditions. We can add multiple severity levels to get different alerts from our datapoint values using basic if statements.
Favorite system
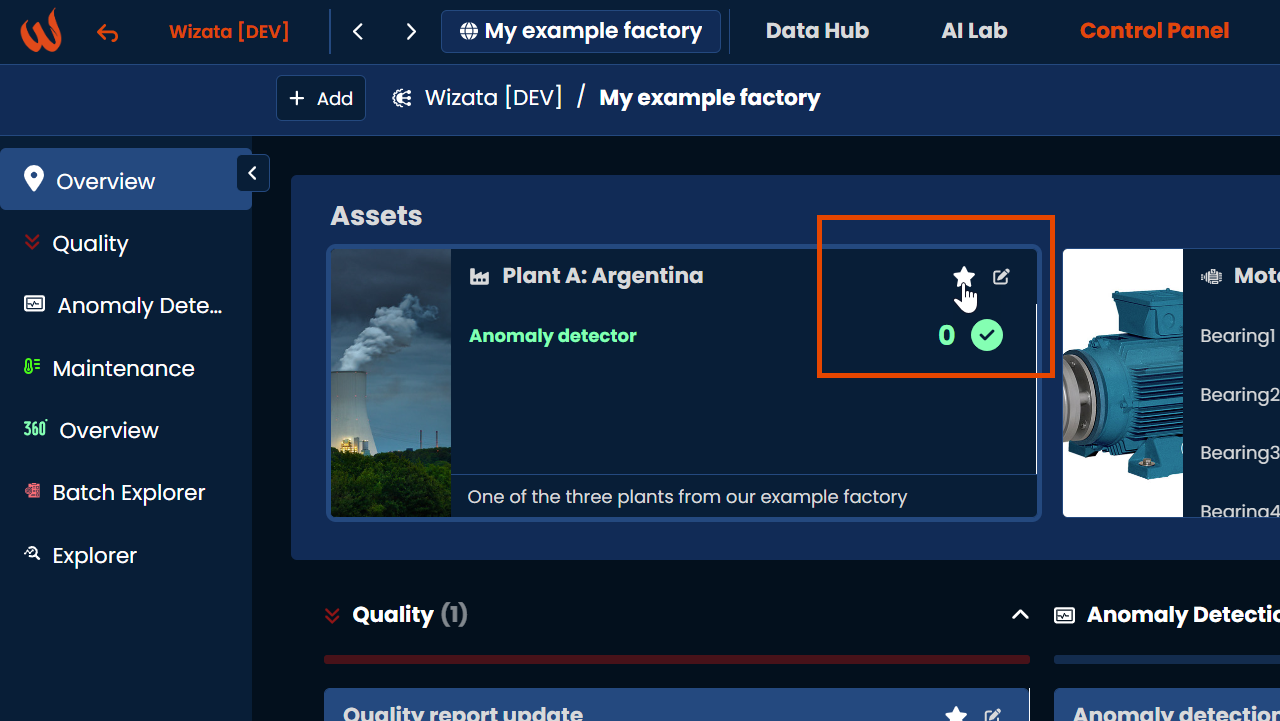
Starting v11.1, you will be able to select your favorite components and assets and filter them using the new Control Panel Filters
Components
Components offers an extensive solution for users to interact with AI solutions : production efficiency, quality control, downtime analysis, and more..
The Control Panel seamlessly integrates with other manufacturing systems and databases, ensuring that all relevant data is consolidated into a single platform. The platform offers different types of component solutions to monitor and visualize AI solutions:
- Dashboard: A native, built-in and easy-to-use, dashboarding tool.
- Grafana: Using Grafana dashboard instead of our native one as an alternative. A Grafana instance must be integrated in prior to be able to use it.
- Iframe: Integrate any content or app as long as an Iframe link can be obtained, such as external data tools, reporting apps (PowerBI, Tableau, etc.), images feed, and much more.
- Streamlit: You can embed deployed Streamlit Python solutions as components. This is a good solution for data scientists and AI/ML engineers to deliver interactive data apps and integrate them inside the platform.
Updated 9 months ago