Wizata library for common functions
The Wizata Python toolkit includes several built-in libraries—scripts, models, and plots—designed to help users streamline common operations in their pipelines. These functions are meant to reduce repetitive code and provide reliable tools for preprocessing, feature engineering, visualization, and more.
You can access these libraries directly by importing from
wizata_dsapi, and all available methods are listed in the official SDK documentation.
Scripts
The wizata_dsapi.scripts module contains ready-to-use utilities for manipulating and transforming data. For example, the .merge() method can be used to combine multiple DataFrames stored in a Context object:
import wizata_dsapi

df_a = wizata_dsapi.api().query(datapoints=["mt1_bearing1"], start="now-1h", end="now", interval=60000)
df_b = wizata_dsapi.api().query(datapoints=["mt1_bearing2"], start="now-1h", end="now", interval=60000)

import wizata_dsapi.scripts

context = wizata_dsapi.Context()
context.append("a", df_a)
context.append("b", df_b)

df_ab = wizata_dsapi.scripts.merge(context=context)
print(df_ab)
sensorId mt1_bearing1 mt1_bearing2
Timestamp
2025-05-20 20:07:00+00:00 0.061626 0.074909
2025-05-20 20:08:00+00:00 0.059836 0.075047
2025-05-20 20:09:00+00:00 0.060172 0.074794
2025-05-20 20:10:00+00:00 0.061058 0.074869
2025-05-20 20:11:00+00:00 0.061517 0.074748
2025-05-20 20:12:00+00:00 0.060233 0.074954
2025-05-20 20:13:00+00:00 0.061497 0.074625
...
2025-05-20 20:59:00+00:00 0.061464 0.074507
2025-05-20 21:00:00+00:00 0.061588 0.073375
2025-05-20 21:01:00+00:00 0.060123 0.075598
2025-05-20 21:02:00+00:00 0.061395 0.074130
2025-05-20 21:03:00+00:00 0.061446 0.075151
2025-05-20 21:04:00+00:00 0.060299 0.074455
2025-05-20 21:05:00+00:00 0.061687 0.075248You can find all available library scripts here
Models
The wizata_dsapi.models module includes various tools to help prepare and analyze data using common modeling techniques. These can be useful in feature preparation steps or predictive tasks within pipelines.
Instead of manually configuring a model, you can simplify your workflow by using the built-in functions. For example, you can replace the customized anomaly_detection_model from our Tutorial: Anomaly Detection Solution with the built-in isolation_forest .
To do so, you only need to modify the train_script value inside the model configuration:
pipeline.add_model(
config=wizata_dsapi.MLModelConfig(
train_script='wizata.models.isolation_forest', # We will add the Wizata-built model
features=["Bearing1","Bearing2","Bearing3","Bearing4"],
output_append=True,
output_columns_names=["bearing_anomaly"],
function="predict",
model_key="ad_model",
by_twin=True
),
input_df='df_processed',
output_df='df_predict'
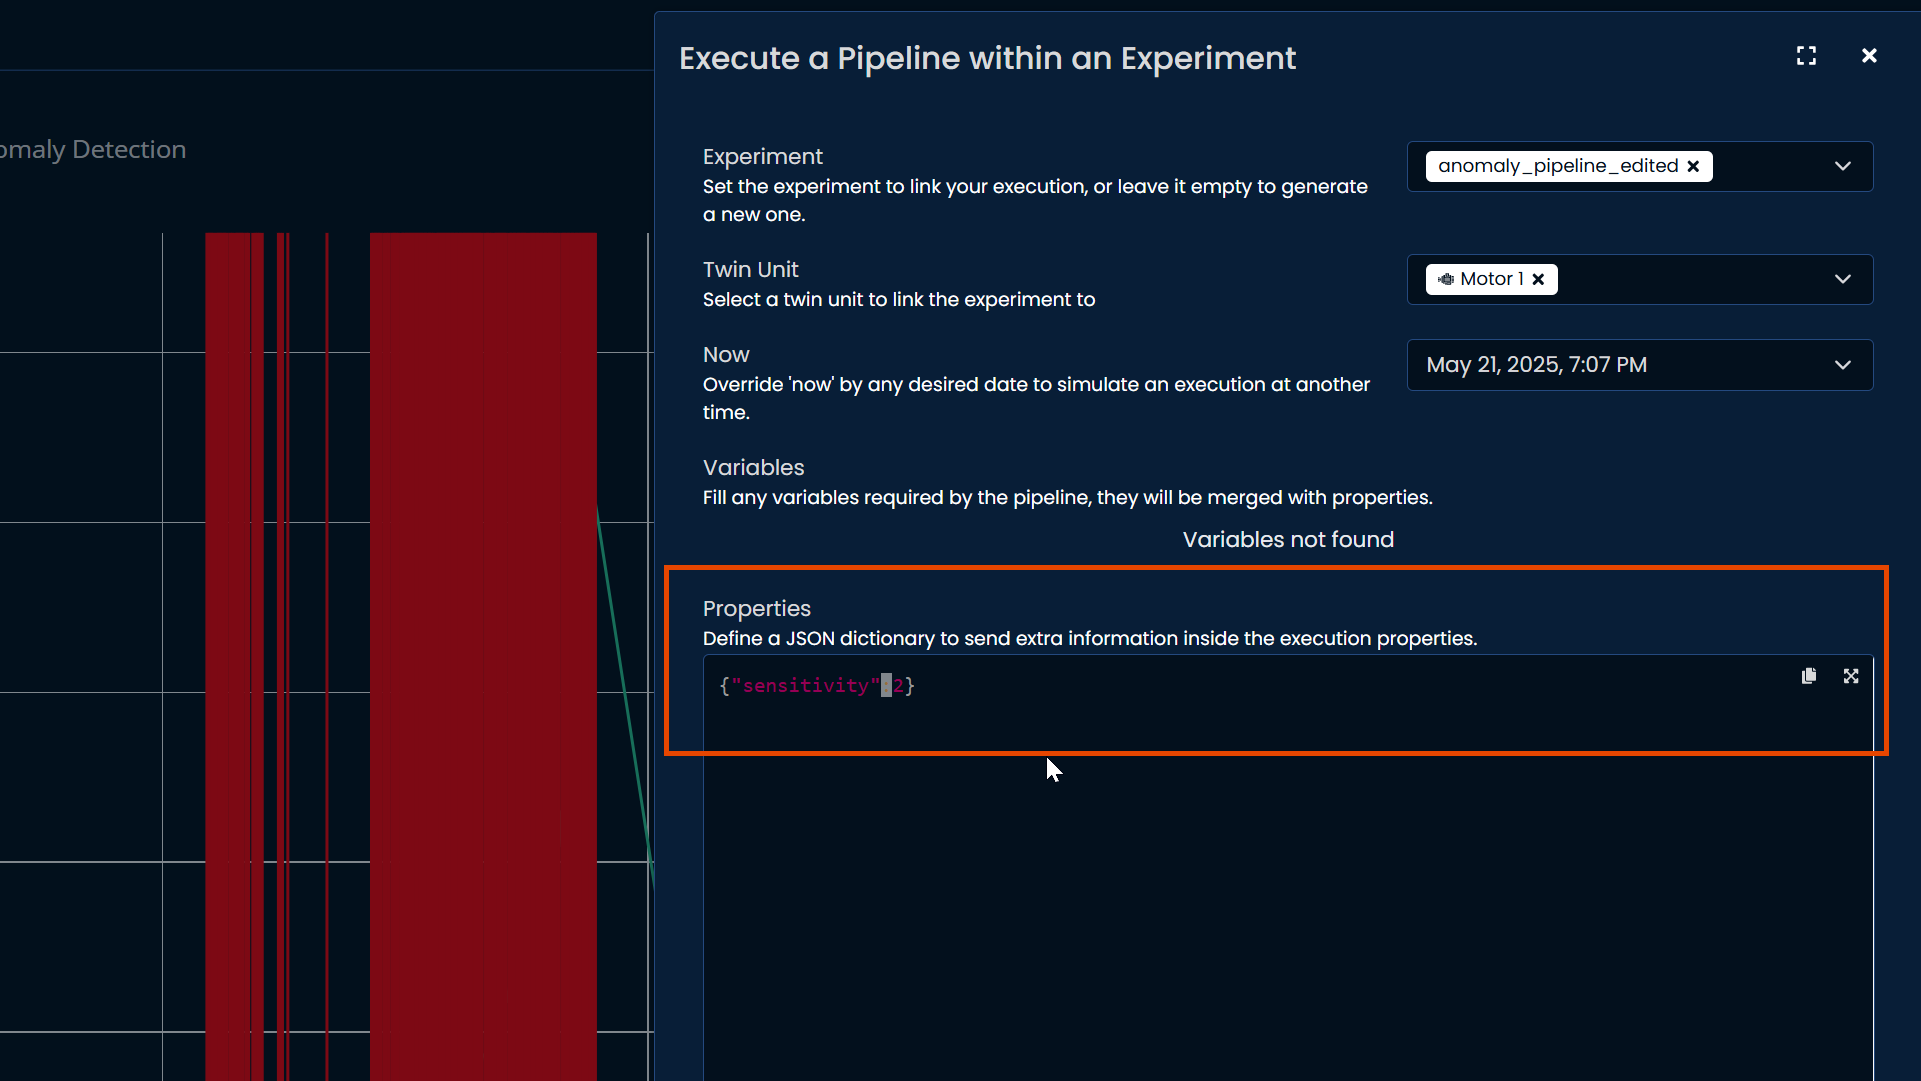
)Additionally, the Isolation Forest model requires a sensitivity property to adjust how strict the anomaly detection should be. You can define this property in two ways:
- Through the UI, by including it in the Properties field as a JSON dictionary:
- Or through Python toolkit, by passing the value in the
propertiesargument when executing the pipeline:
execution = wizata_dsapi.api().experiment(
    experiment='anomaly_pipeline_edited',
    pipeline='anomaly_pipeline_edited',
    twin='motor_1',
    properties={
        'sensitivity': 2
    },
    train=True,
    plot=False,
)
You can find all available library models here
Plots
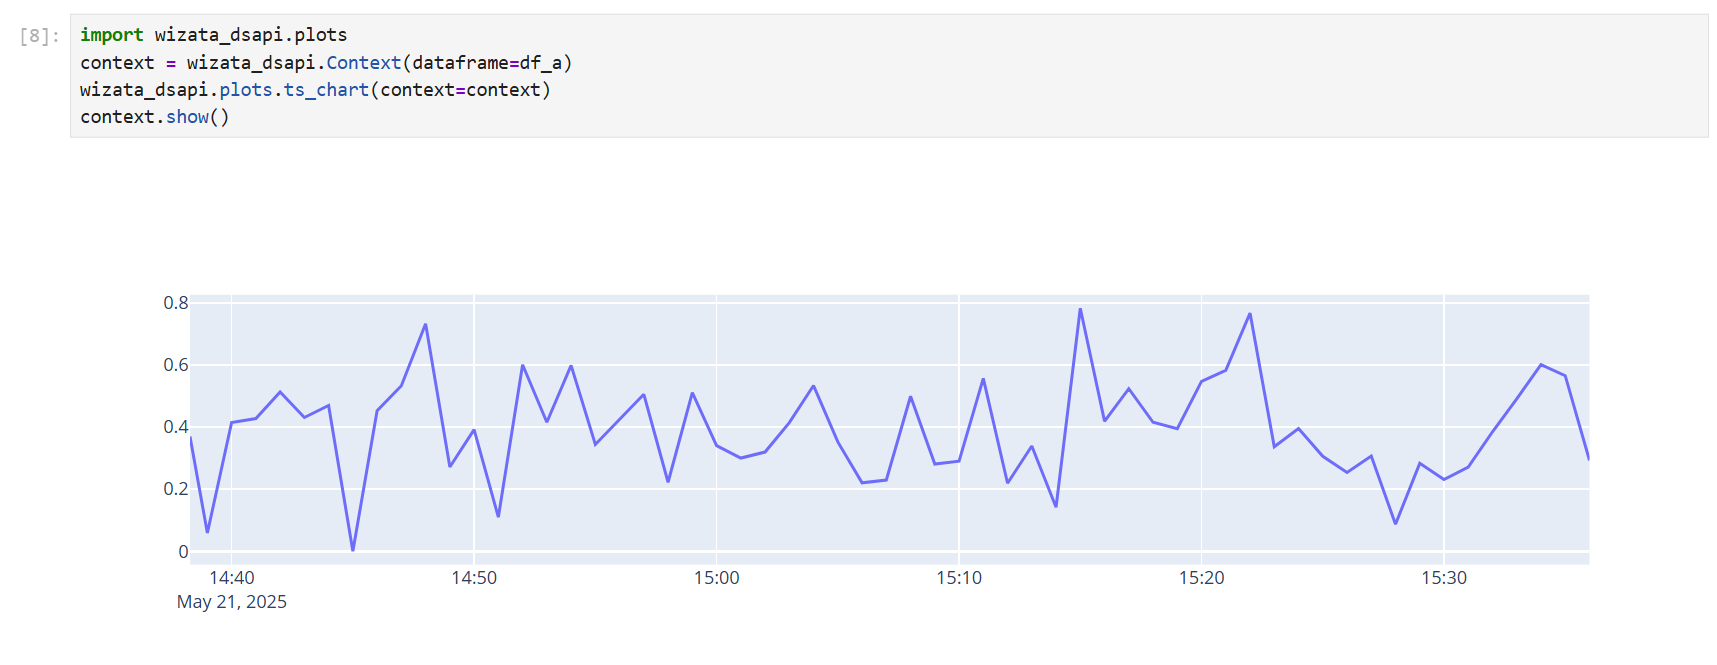
The wizata_dsapi.plots module simplifies the creation of interactive time series charts using Plotly.
For example, you can use .ts_chart() to display a time-series chart of the result for the merged query previously shown:
You can find all available library plots here
Updated 9 months ago