Creating a Grafana Component
As mentioned in the Control panel overview article, Wizata enables you to integrate your Grafana dashboards directly into the platform. In this article, we will walk you through the necessary steps to implement this solution in your environment.
Prerequisites
To follow this example, you must have your Grafana environment already integrated with the platform. You can refer to our dedicated article for the initial configuration.
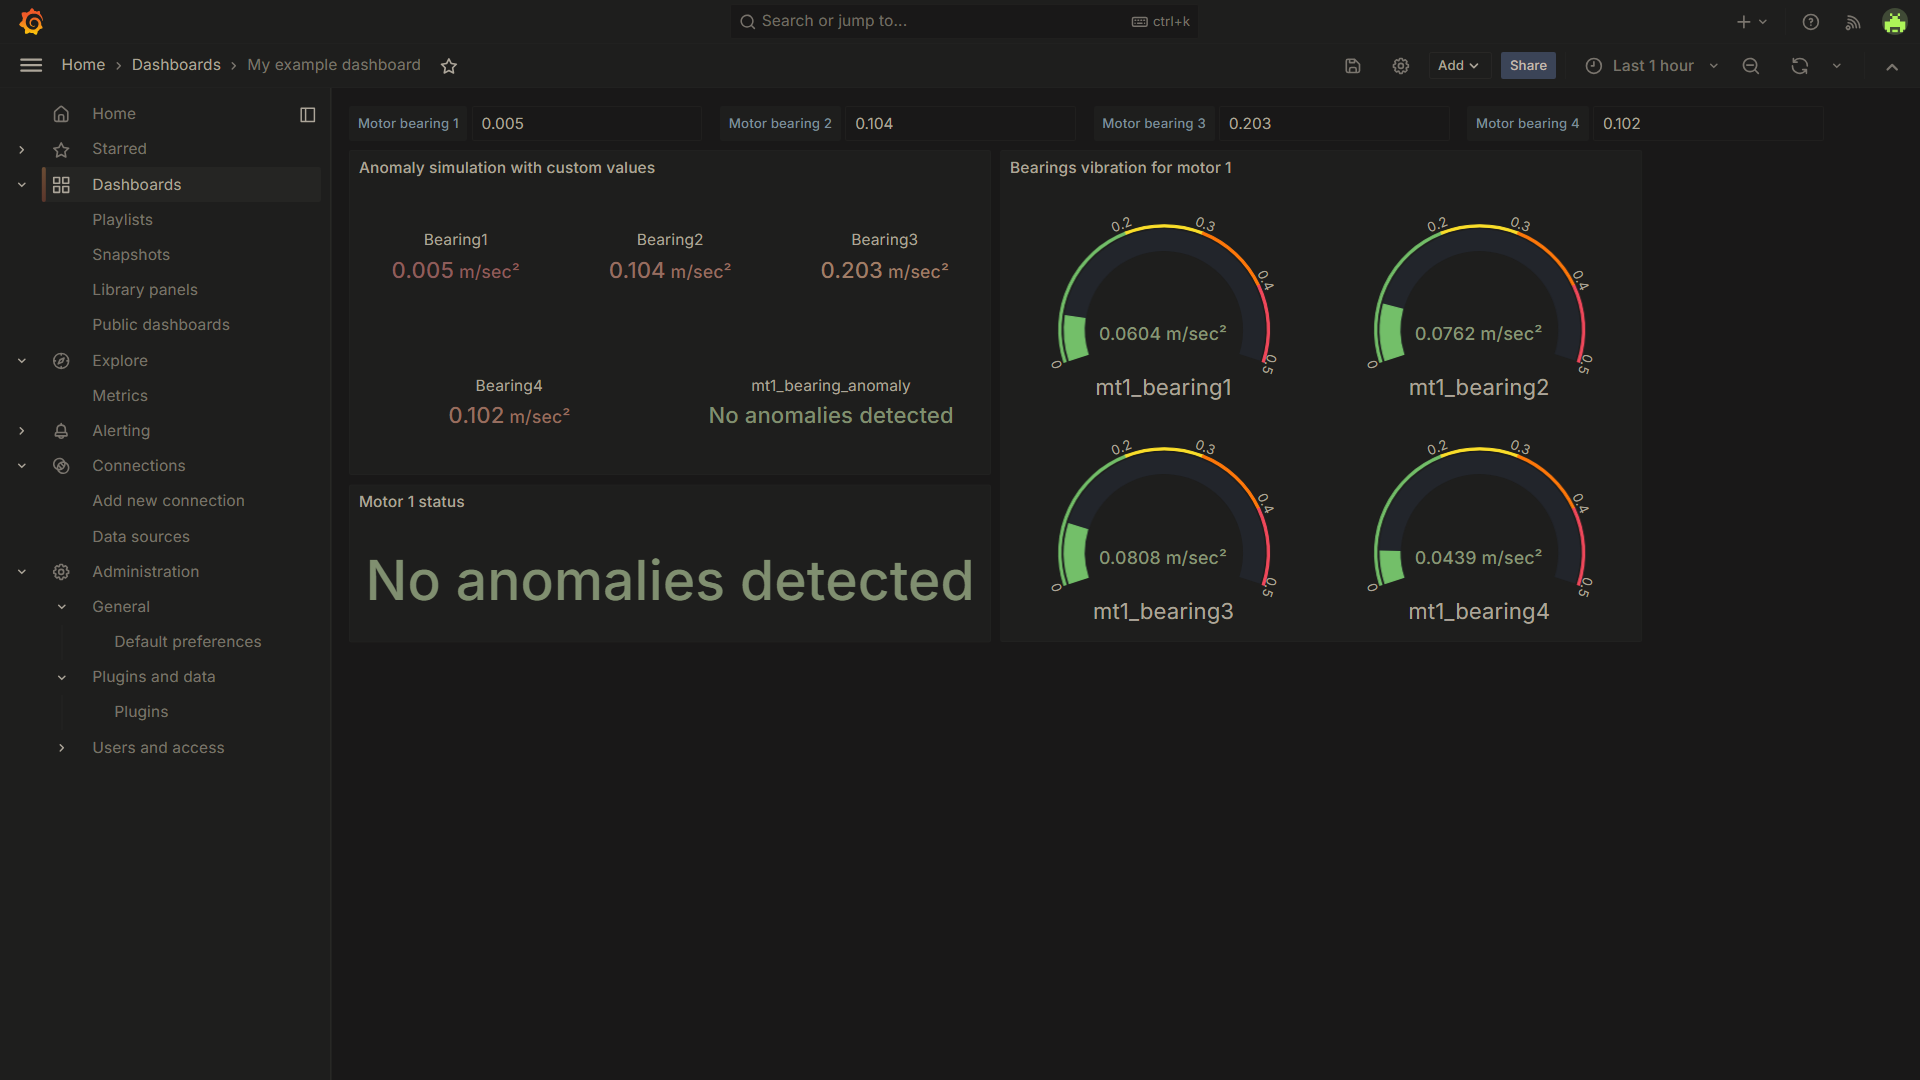
Once your Grafana environment is successfully configured into the platform, you will need to have a dashboard already set up. For this example, we will use the Grafana dashboard from the Wizata custom plugin article, using the data sample from the Connect article.
Additionally, we will also need the Grafana dashboard's URI, which is required as a parameter when creating the Grafana component in the platform. To get this, go to your dashboard and copy the relative URL, which typically follows this format: d/grafanaUID/name
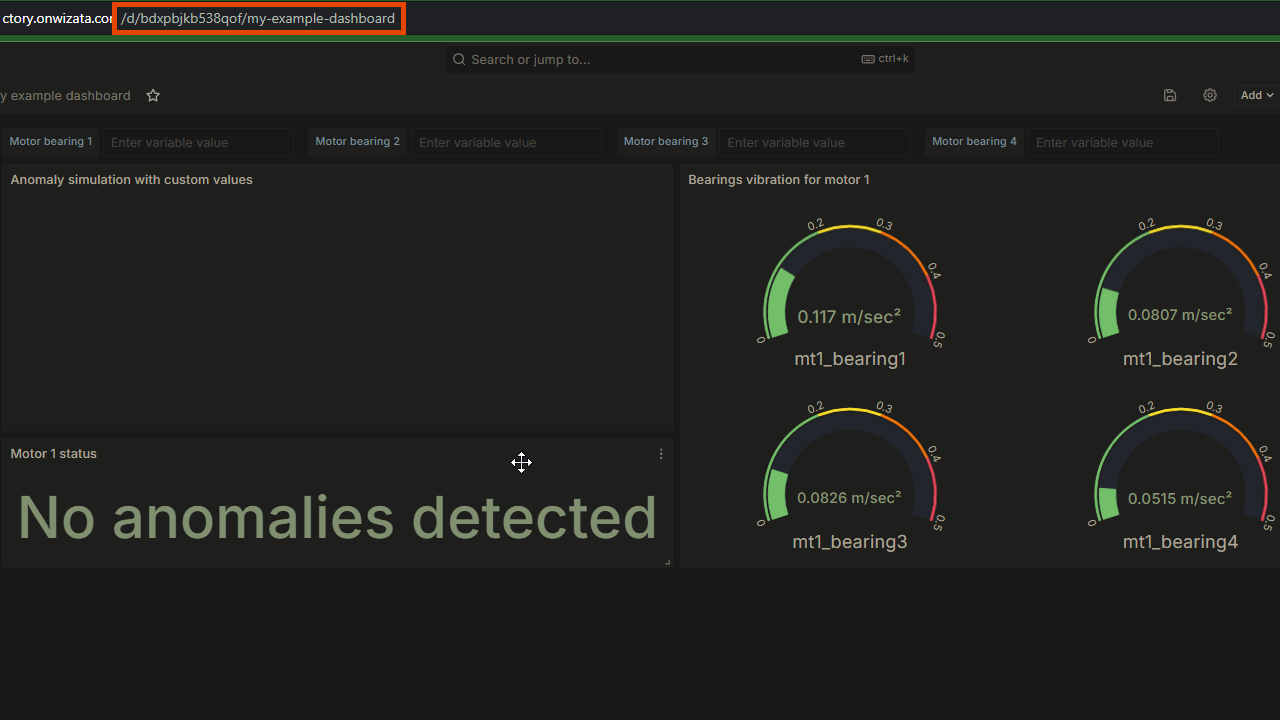
In our case, the relative URI is
d/bdxpbjkb538qof/my-example-dashboard.
Creating the component and updating the dashboard
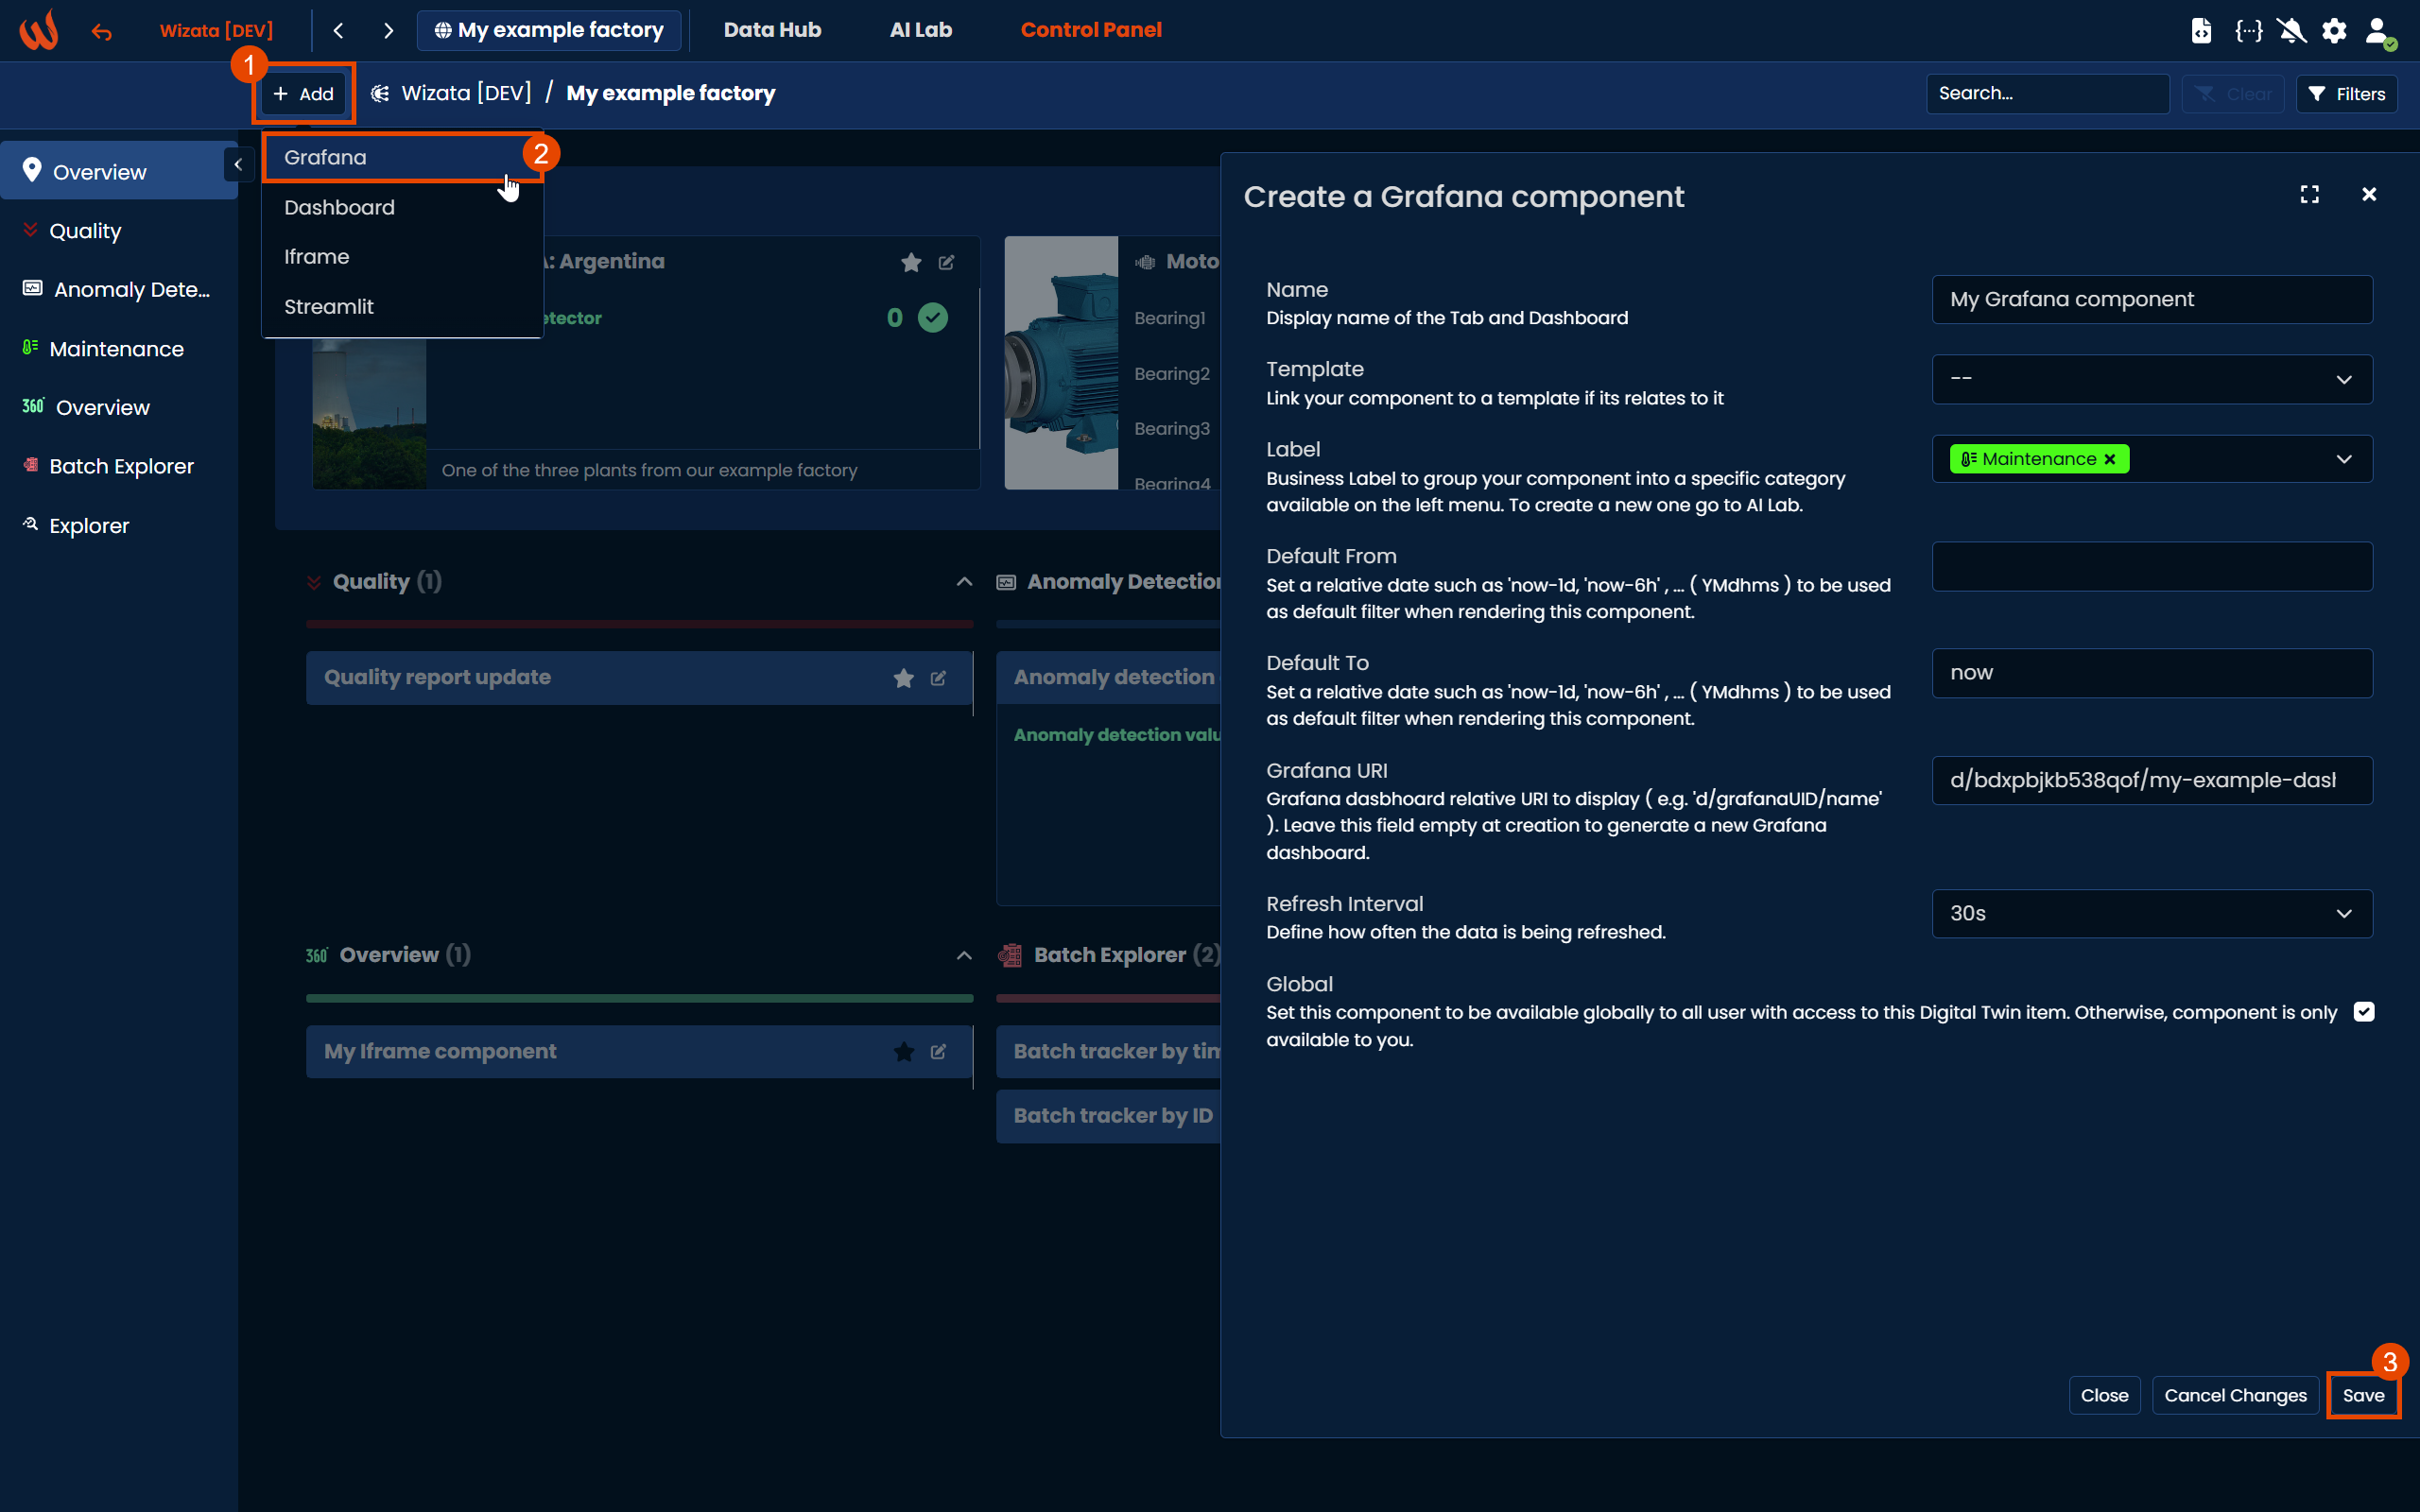
To begin, navigate to the Control Panel section and create a Grafana component. Among the options, you can select a relative Template, attach a business label to group it within a specific category on the left menu, set a default datetime to be used as a filter when rendering the component, and define how often the data is being refreshed by selecting a refresh interval. As we mentioned before, you will also need to insert the Grafana relative URI.
Once you click Save, you will be rendered with your Grafana dashboard in the platform's Control panel component:
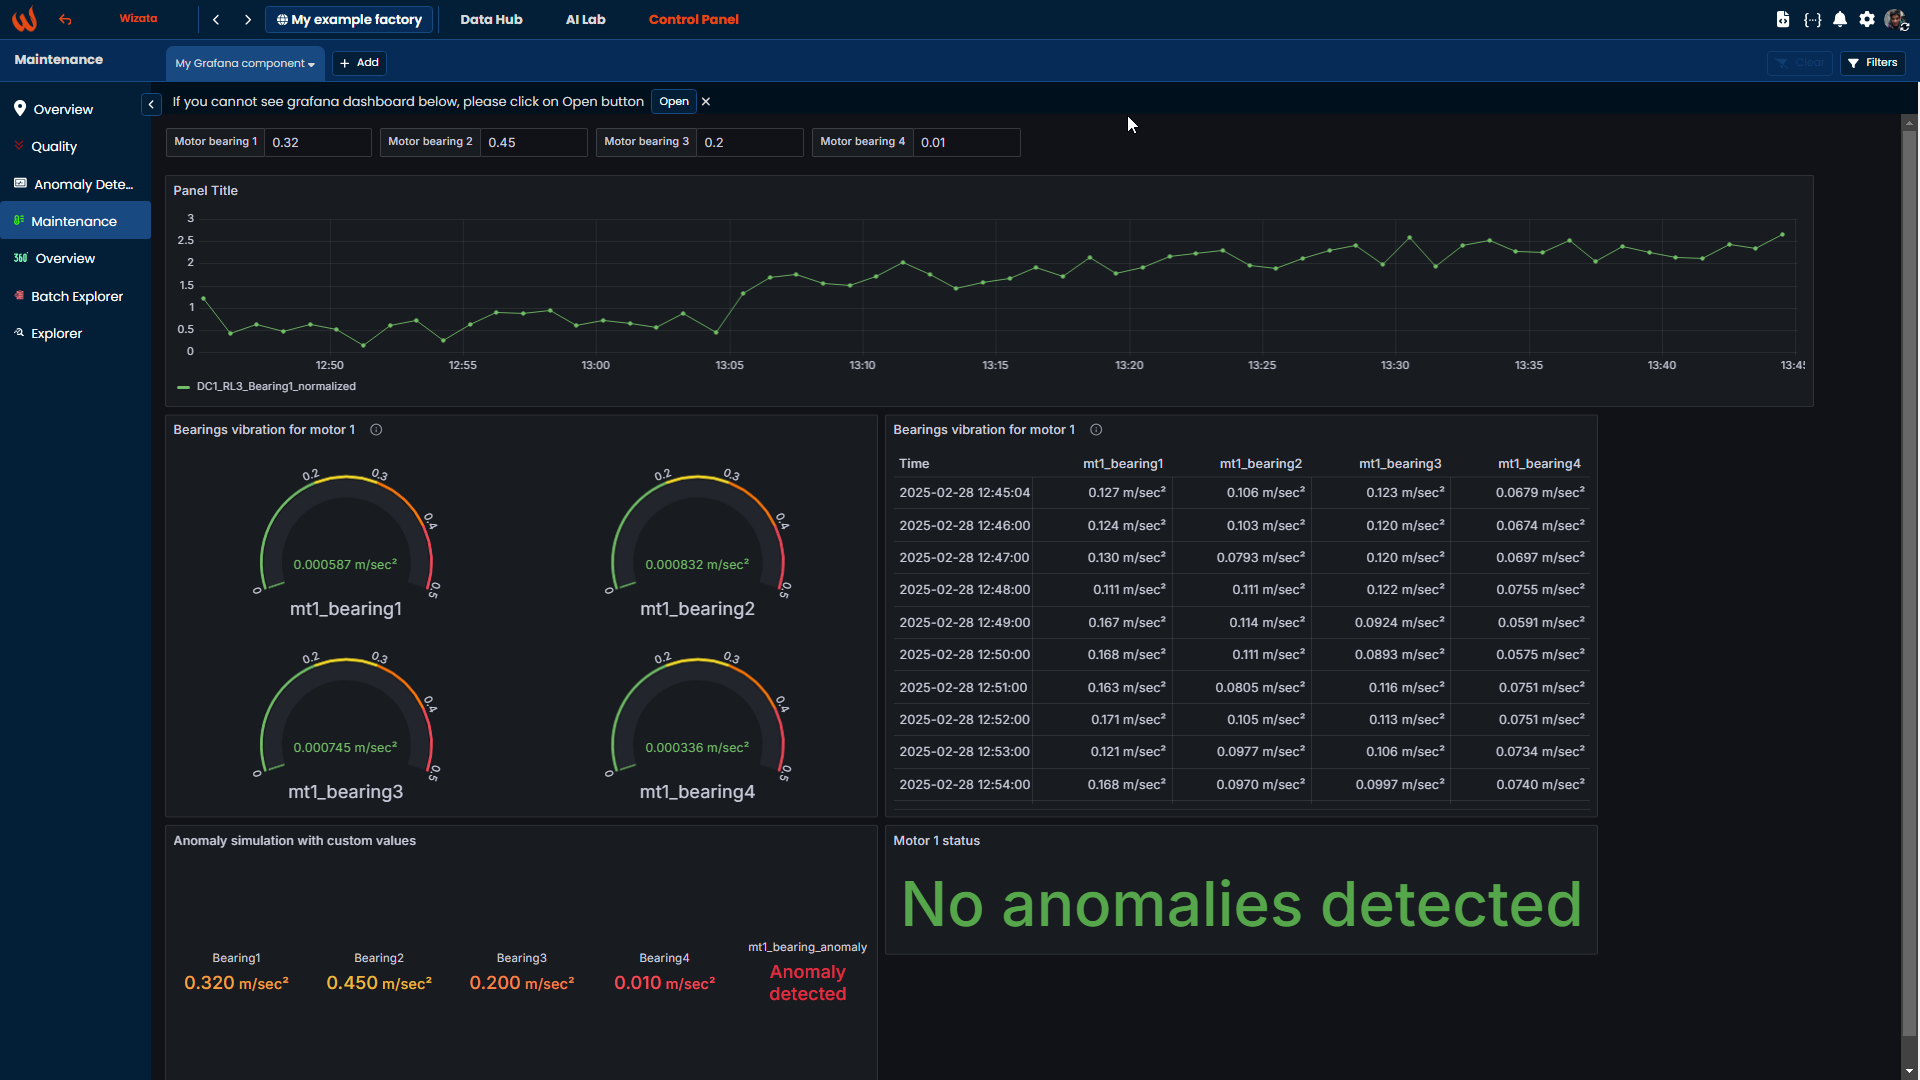
You can also add custom variables to run the pipeline in the platform interface, and the values will automatically be updated on the dashboard.
Additionally, you can modify the Grafana component within the platform, similar to the same way you would edit a native dashboard. To do this, click on the arrow (1) and select Enter Edit Mode (2), which will take you to the Grafana dashboard configuration.
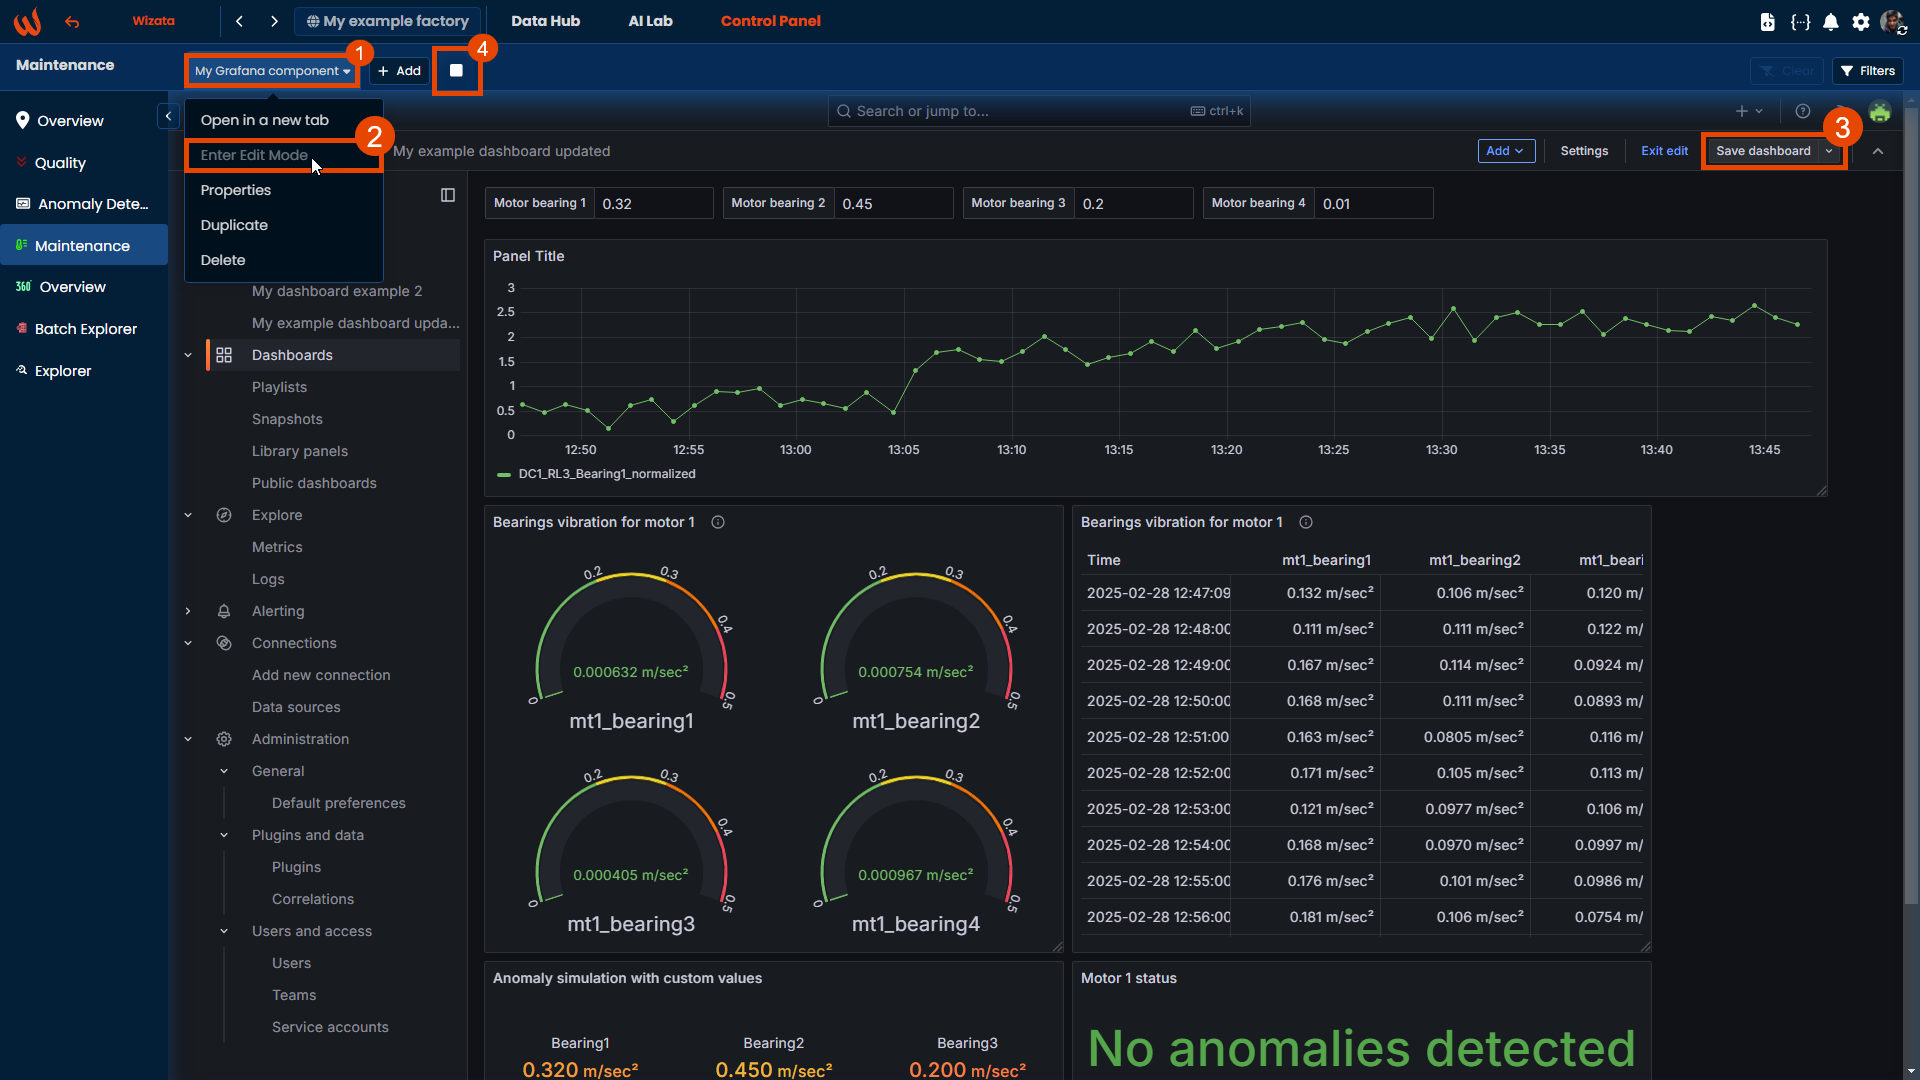
Once you have finished configuring your dashboard, first save it within Grafana UI (3) and then click on the square option (3) to exit Edit mode and to save the changes on your component.
Settings
Light Mode
By default, Grafana panels are displayed in dark mode. You can switch your Grafana components to light mode directly from the Control Panel UI by clicking the toggle option available within each component.
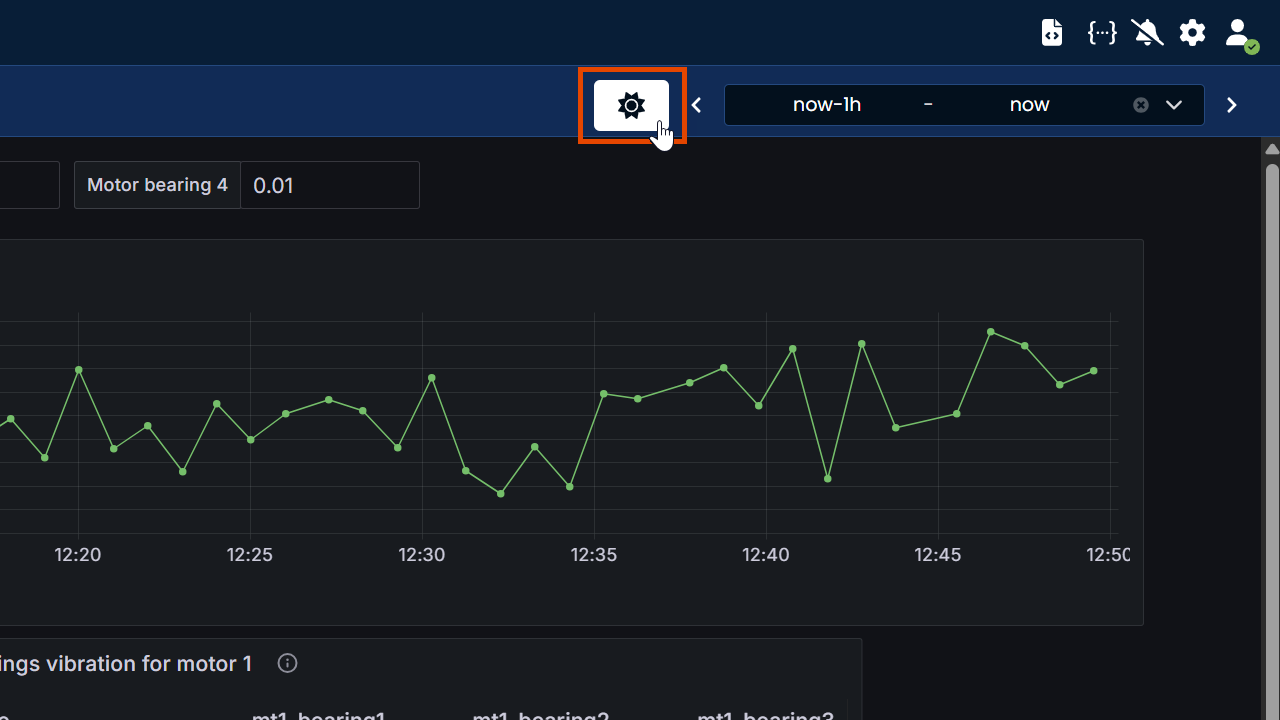
Time Interval selector
By default, Grafana panels display data from the last hour. You can customize the time range shown in the panel using the built-in time interval selector, located in the upper right corner of the component.
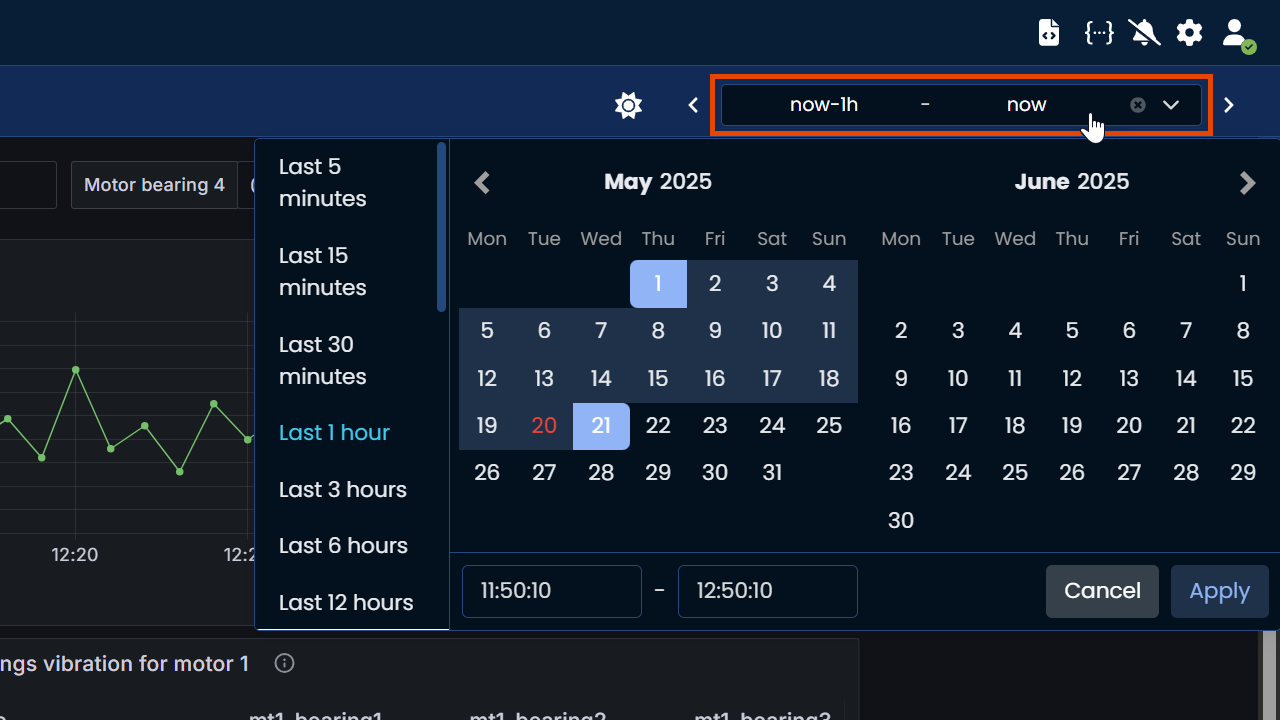
This selector allows you to:
- Choose a predefined range (e.g., Last 5 minutes, Last 1 hour, Last 12 hours, etc.)
- Select a specific date range from the calendar.
- Manually set custom start and end times
Since v11.2 we have added significant changes to the Time interval for your Grafana and Streamlit solutions. You can refer to our documentation article for more details: Interacting with Time Interval selector
Updated 9 months ago