Tutorial: Twin Structure and Datapoint Properties summary
In this tutorial, we will capsulate all the key concepts of Twins and Data Points, focusing on their structure and properties. We will create a sample twin structure that will serve as the foundation for the Anomaly Detection Solution example. The goal is to create an appropriate twin structure, attach datapoints and edit their properties, reviewing all the steps we have been working this last articles regarding Data Hub.
Prerequisite
For this article we will be using the sample data from the motor bearings, from the dedicated article on how to Upload a small data file through Azure Event Hub. Before proceeding, ensure that your data has been successfully uploaded to the platform.
Create a twin structure
The first step involves creating the appropriate twin structure, representing a simple setup of motors with bearing sensors, each located in different plants.
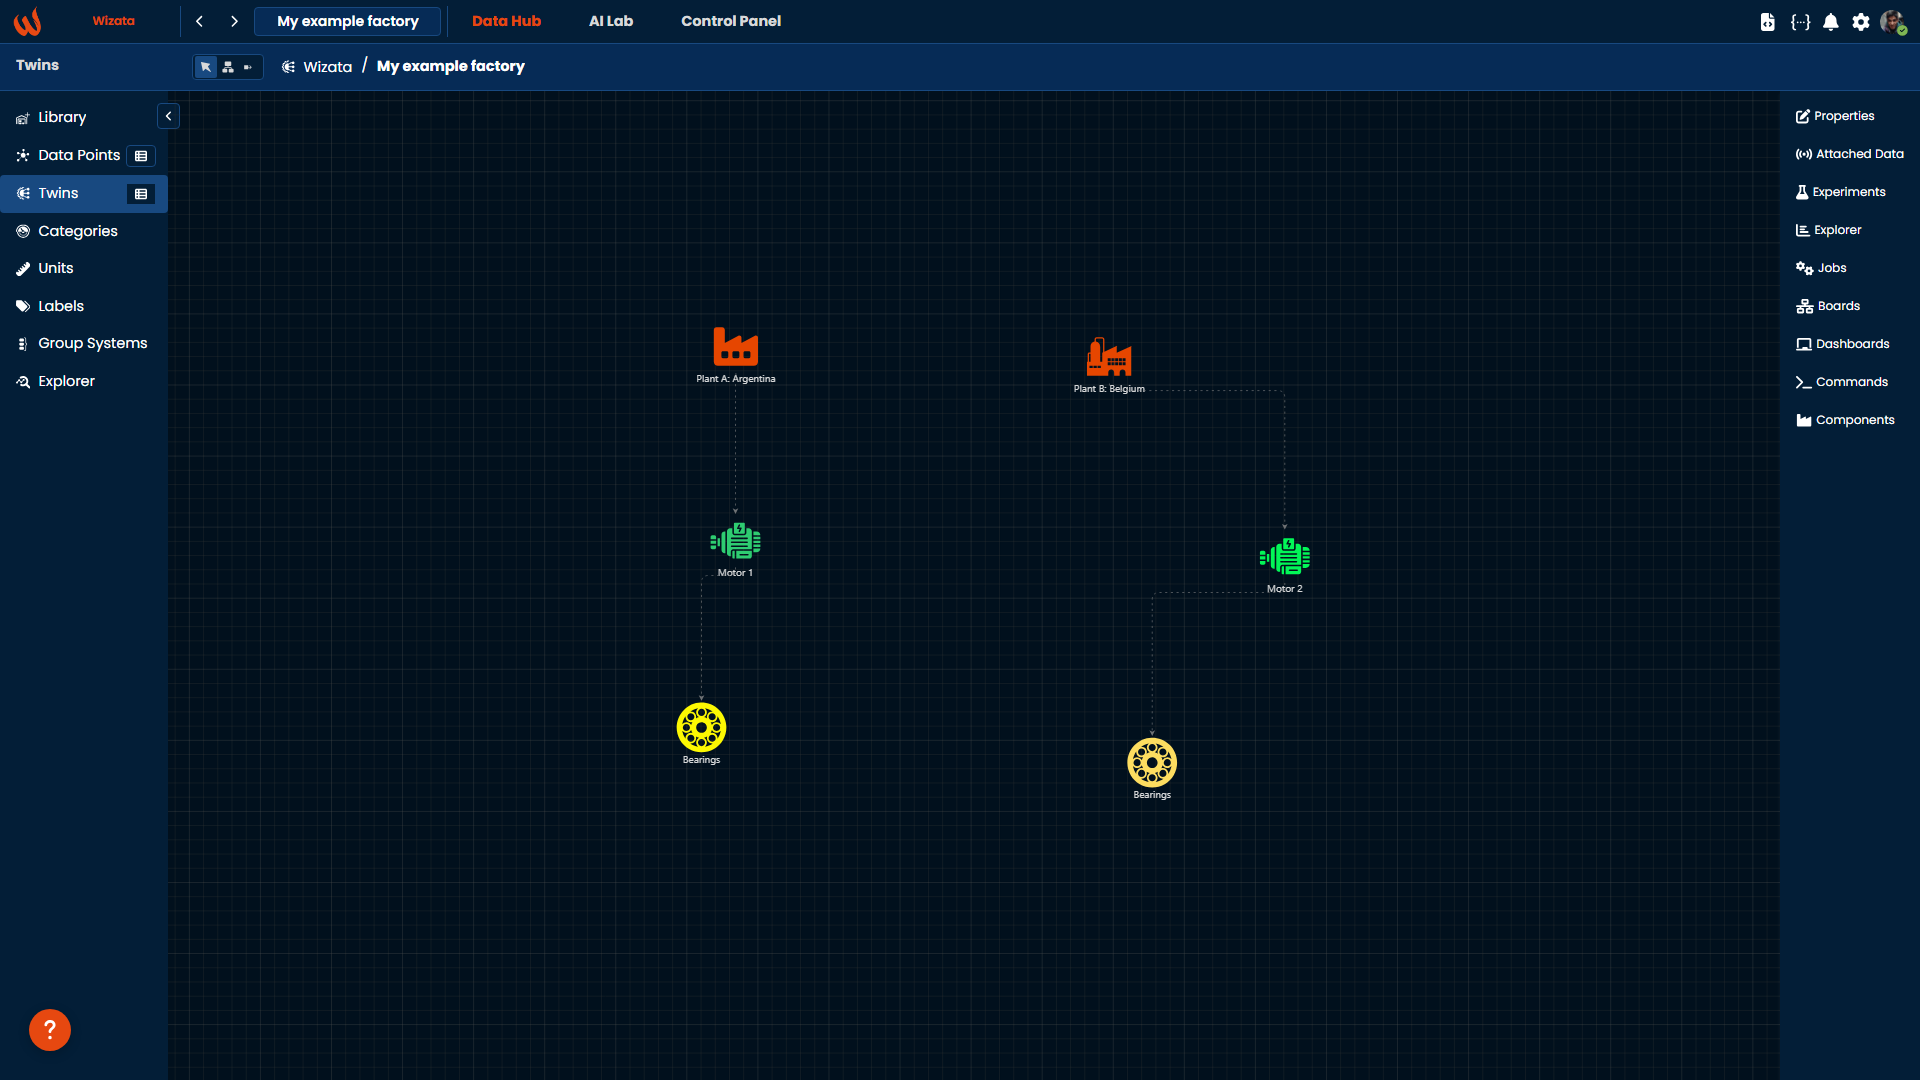
We will begin by creating an area twin named example_factory , following a parent/child hierarchy: the factory will have two different plants, each containing a motor with an attached bearing sensor.
Using the Python Toolkit, you can register your twins using the following logic:
factory_twin_object = wizata_dsapi.Twin(
    name="My example factory",
    hardware_id="example_factory"
)

wizata_dsapi.api().create(factory_twin_object)

# Creating plant A
plant_a = wizata_dsapi.Twin(
    name="Plant A: Argentina",
    parent_id=factory_twin_object.twin_id,
    hardware_id="plant_Argentina"
)

wizata_dsapi.api().create(plant_a)

motor1 = wizata_dsapi.Twin(
    name="Motor 1",
    parent_id=plant_a.twin_id,
    hardware_id="motor_1"
)

wizata_dsapi.api().create(motor1)

bearing2 = wizata_dsapi.Twin(
    name="Bearing sensor 2",
    hardware_id="bearing_sensor2",
    parent_id=motor1.twin_id
)

wizata_dsapi.api().create(bearing2)
You should also replicate the same twin structure for
plant_b,motor2andbearing1
After running the script, your environment should look like the image below, with all sensors correctly attached to bearings on motors one and two:
Adding datapoints to our twins
With the twin structure in place, the next step is to attach the datapoints of the motor bearings to their corresponding twins.
The following script retrieves datapoints from the platform (Created automatically when data was uploaded using Event Hub, as mentioned in the prerequisite), and then link their twin id to the motor 2 twin id.
datapoint_partial_name = 'mt2_'
i = 1
page_size = 20
total = None
has_more = True

datapoints = None
twin_asset = wizata_dsapi.api().get(key='bearing_sensor2', entity=wizata_dsapi.Twin)

while has_more:
    datapoints = wizata_dsapi.api().search_datapoints(hardware_id=datapoint_partial_name, page=i, size=page_size)
    if i == 1:
        total = datapoints.total
    for datapoint in datapoints.results:
        datapoint.twin_id = twin_asset.twin_id
        wizata_dsapi.api().upsert_datapoint(datapoint)
datapoint_partial_name = 'mt1_'
i = 1
page_size = 20
total = None
has_more = True
datapoints = None
twin_asset = wizata_dsapi.api().get(key='bearing_sensor1', entity=wizata_dsapi.Twin)
while has_more:
datapoints = wizata_dsapi.api().search_datapoints(hardware_id=datapoint_partial_name, page=i, size=page_size)
if i == 1:
total = datapoints.total
for datapoint in datapoints.results:
datapoint.twin_id = twin_asset.twin_id
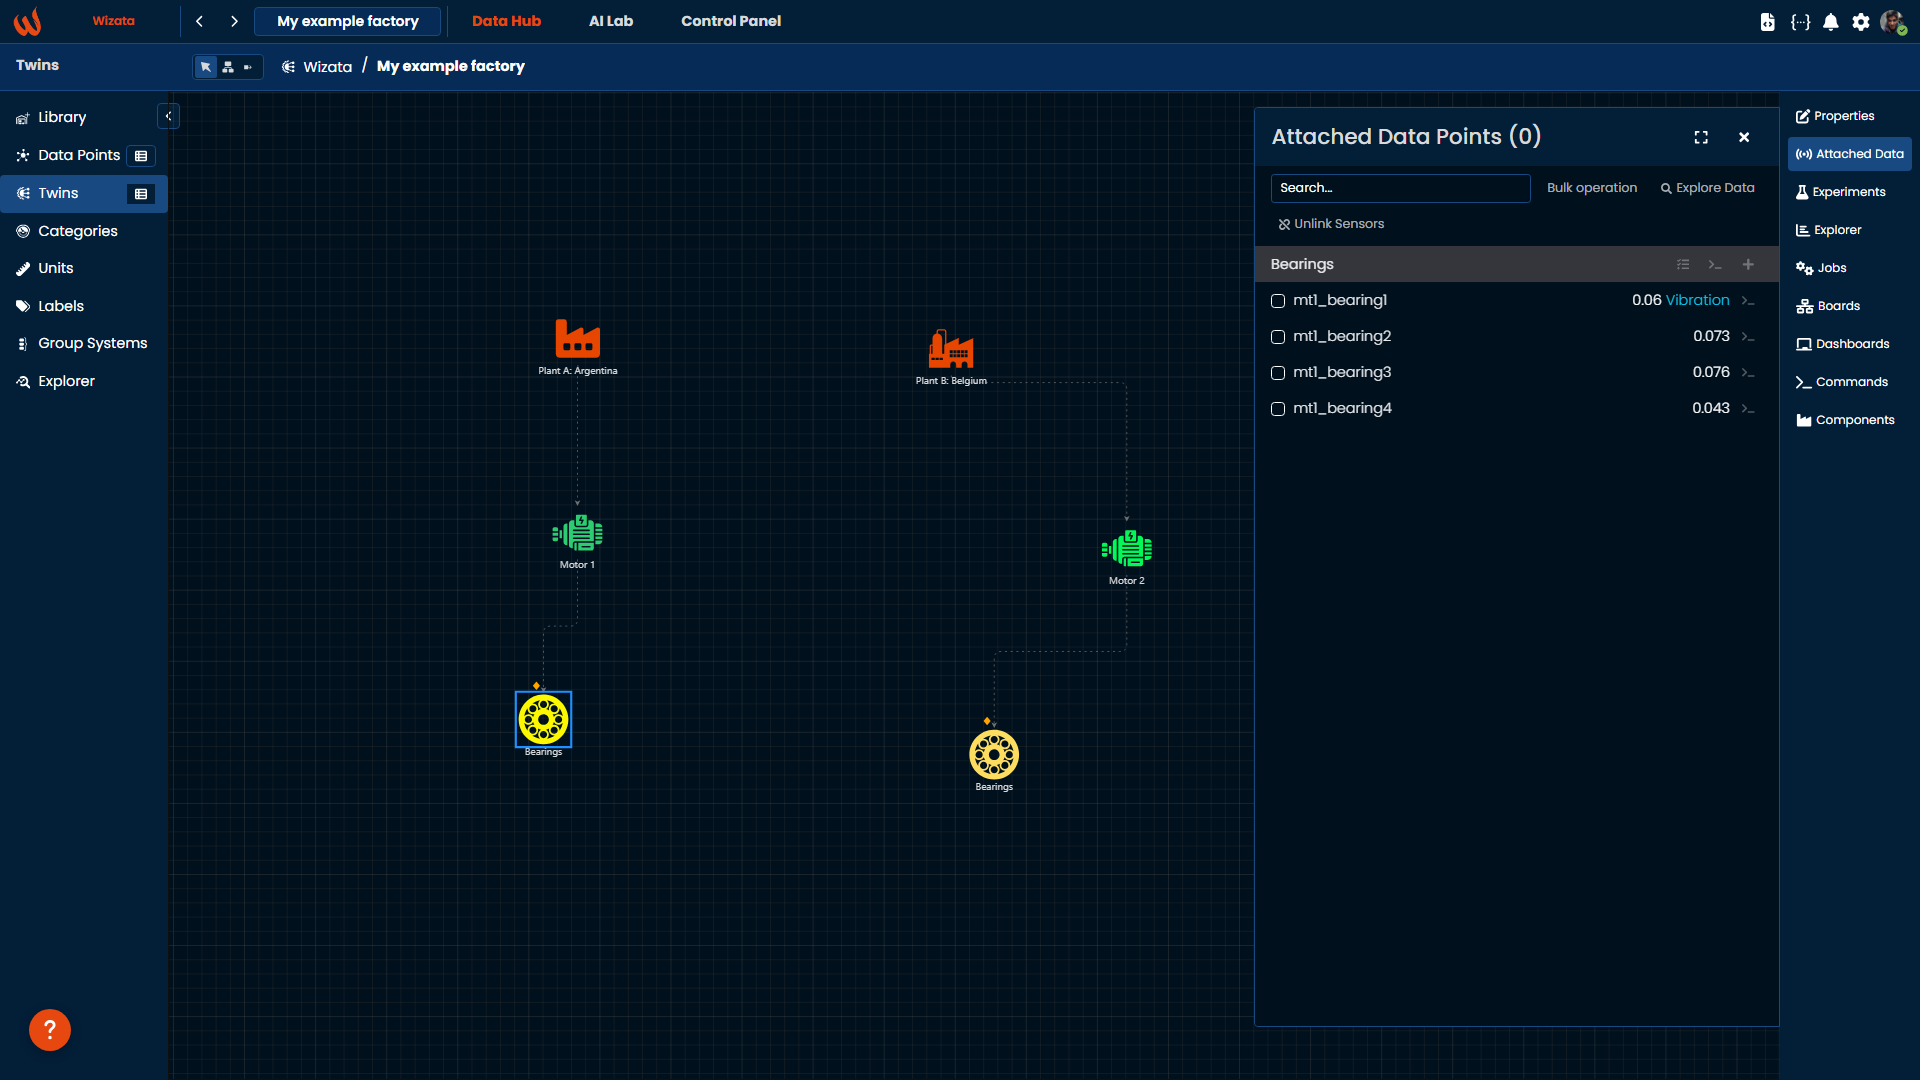
wizata_dsapi.api().upsert_datapoint(datapoint)Once the datapoints are properly attached, an orange diamond will appear on top of the twin icon. Additionally, by clicking on Attached data we will view all the different datapoints for the motor bearings correctly linked to their corresponding digital twins.
Using a similar method, we can also use the Python Toolkit to edit datapoints properties like Categories, units and labels.
Edit datapoint properties
In cases where we need to automatically modify certain properties for a group of datapoints, a Python script can streamline the process. Python Toolkit provides dedicated methods like get_categories or get_units to retrieve metadata from the platform. You can update datapoint properties by modifying the object values and using upsert_datapoint to save the changes.
For example, let's group all bearing-related datapoints under the same Vibration category, and assign a common unit to represent the motor bearing's vibration measured in Newtons (N) .
category_id = None
categories = wizata_dsapi.api().get_categories()
if 'Vibration' in categories:
    category_id = categories['Vibration']
else:
    category = wizata_dsapi.Category(name='Vibration')
    wizata_dsapi.api().create(category)

units = wizata_dsapi.api().get_units()
unit_id = units.get('N')

datapoint_partial_names = ['mt1_', 'mt2_']

for partial_name in datapoint_partial_names:
    i = 1
    page_size = 20
    total = None
    has_more = True

    while has_more:
        datapoints = wizata_dsapi.api().search_datapoints(hardware_id=partial_name, page=i, size=page_size)
        if i == 1:
            total = datapoints.total

        for datapoint in datapoints.results:
            datapoint.category_id = category_id
            datapoint.unit_id = unit_id
            wizata_dsapi.api().upsert_datapoint(datapoint)

        total -= page_size
        i += 1
        if total <= 0:
            has_more = False
Data Explorer and Query visualization
The platform offers powerful tools for visualizing and Exploring data:
- The Data Explorer allows you to set specific conditions on your charts, making it easier to identify outliers or validate assumptions based on the data.
- A Query formalizes the process of retrieving data from the time-series database using constraints such as digital twin, time, aggregation, and/or filtering.
We can analyze our bearings data with different aggregation methods in Explorer graphs, group and modify their properties, adjust chart settings and add calculated data points from formulas or Python Script. (For more details, refer to Adding Virtual Data Source to the Explorer)
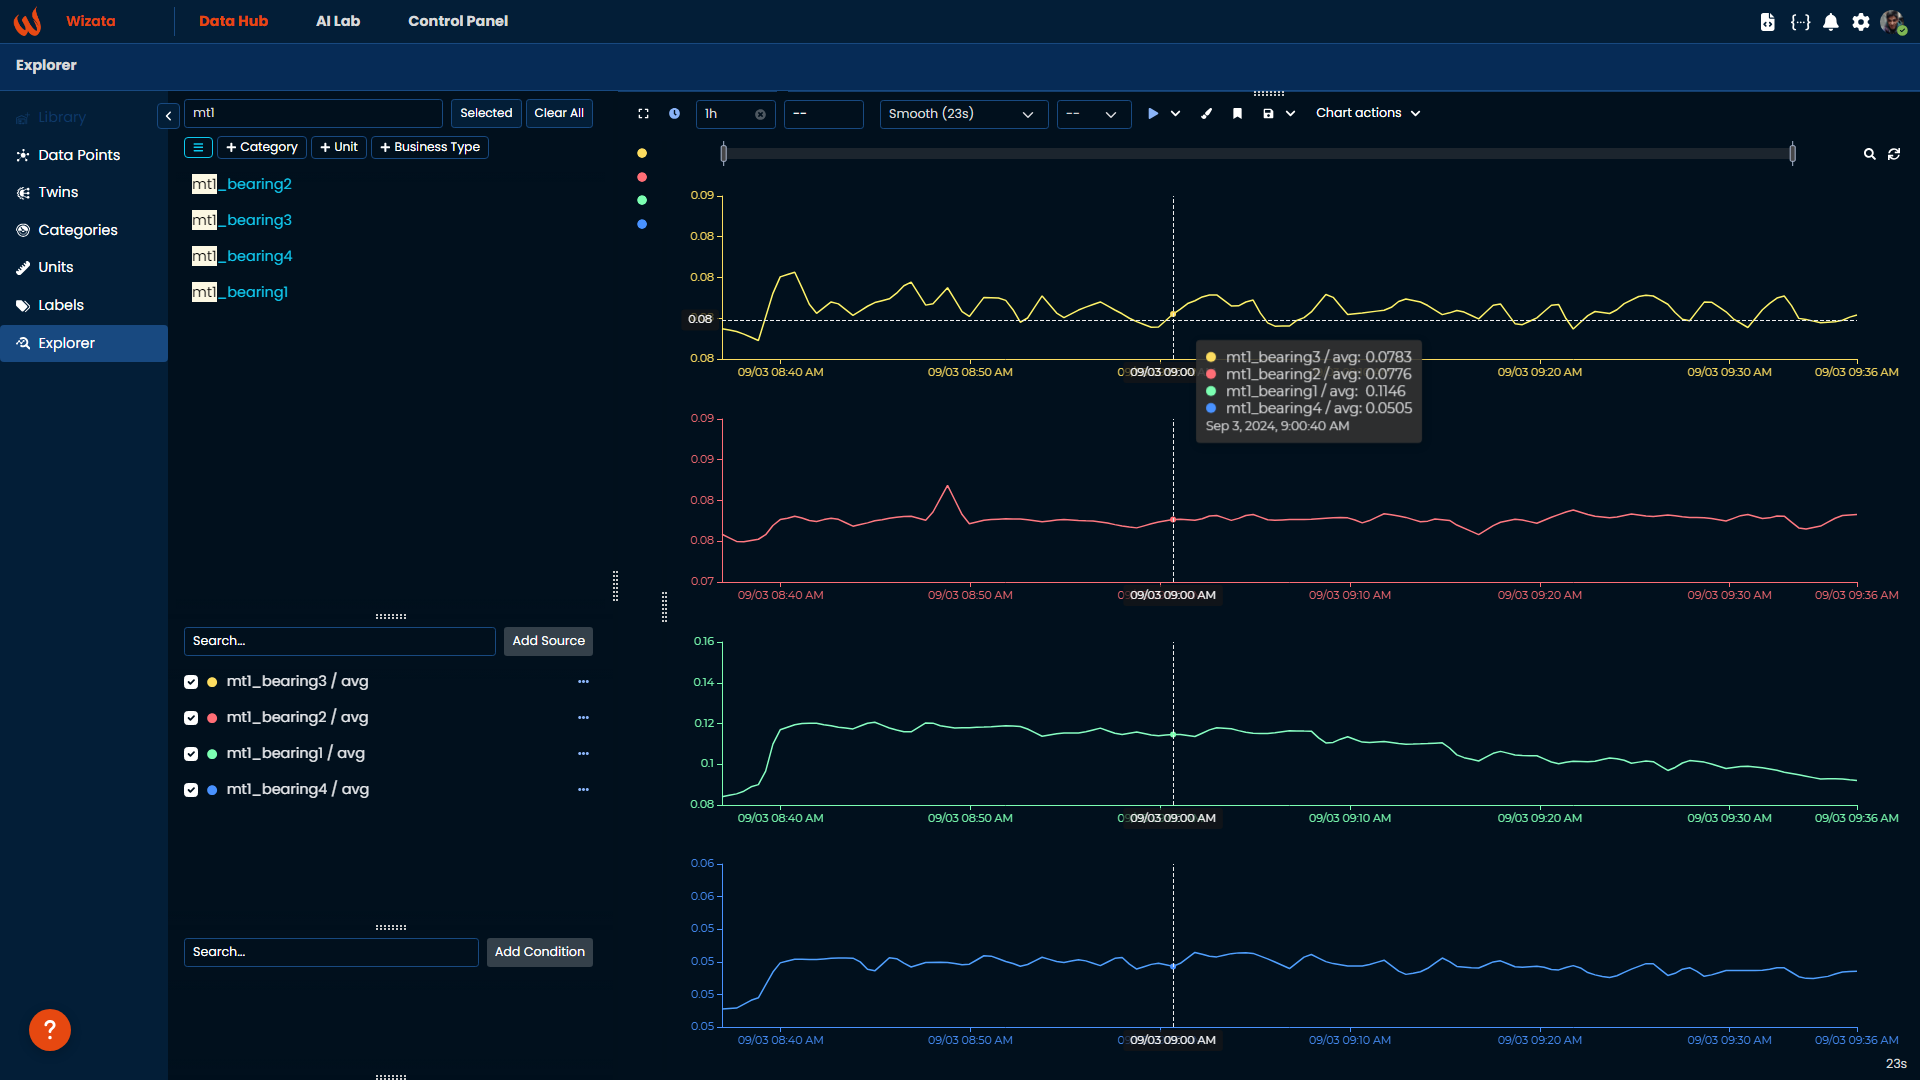
Additionally, we can execute queries using Python to fetch values from the platform's data. For example, to retrieve the data shown in the chart above, you could use a query like this:
df = wizata_dsapi.api().query(
    datapoints=['mt1_bearing1', 'mt1_bearing2', 'mt1_bearing3', 'mt1_bearing4'],
    start="now-1h",
    end="now",
    agg_method="mean",
    interval=60000
)
The response will be a Dataframe containing average values for the list of bearings datapoints for the motor 1 over a specific period, with a 60-second interval.
sensorId                   mt1_bearing1  ...  mt1_bearing4
Timestamp                                ...
2024-09-03 01:59:00+00:00      0.060807  ...      0.043805
2024-09-03 02:00:00+00:00      0.060571  ...      0.043704
2024-09-03 02:01:00+00:00      0.061003  ...      0.044094
2024-09-03 02:02:00+00:00      0.060892  ...      0.044657
2024-09-03 02:03:00+00:00      0.060862  ...      0.045661
...                                 ...  ...           ...
2024-09-03 02:55:00+00:00      0.059822  ...      0.044217
2024-09-03 02:56:00+00:00      0.060386  ...      0.043740
2024-09-03 02:57:00+00:00      0.060210  ...      0.043717
2024-09-03 02:58:00+00:00      0.059926  ...      0.043641
2024-09-03 02:59:00+00:00      0.060255  ...      0.043515
This is just a basic example of an initial query, but you can customize it further by using additional parameters as described in the article related to Query Structures.
Conclusion
In this tutorial, we successfully created a basic twin structure, attaching a sample of bearing sensor data, We have also updated the datapoints properties, explored the data using various platform tools, and prepared the foundational structure to continue with the next steps in the following tutorial: Building an Anomaly Detection Solution.
Updated 9 months ago