
Query step
A query step is used to fetch time-series data from the platform and produce an output Data Frame, that can be used by the subsequent steps in the pipeline. A Query step has only one output and no inputs, meaning it always acts as the starting point of a pipeline.
The query configuration is identical to the Data Hub Query and can be defined either as a wizata_dsapi.Request object or its equivalent JSON form.
Adding a Query step
Using the Pipeline UI, navigate to Library > Queries in the left-hand panel and either drag the block onto the canvas or click + Create new query. Once the block is added, a configuration panel opens on the right, organised in sections — datapoints, timeframe, aggregation, events, scopes, fields — and a Preview Query button runs the block as configured before you save anything. When done, click Ok to confirm.
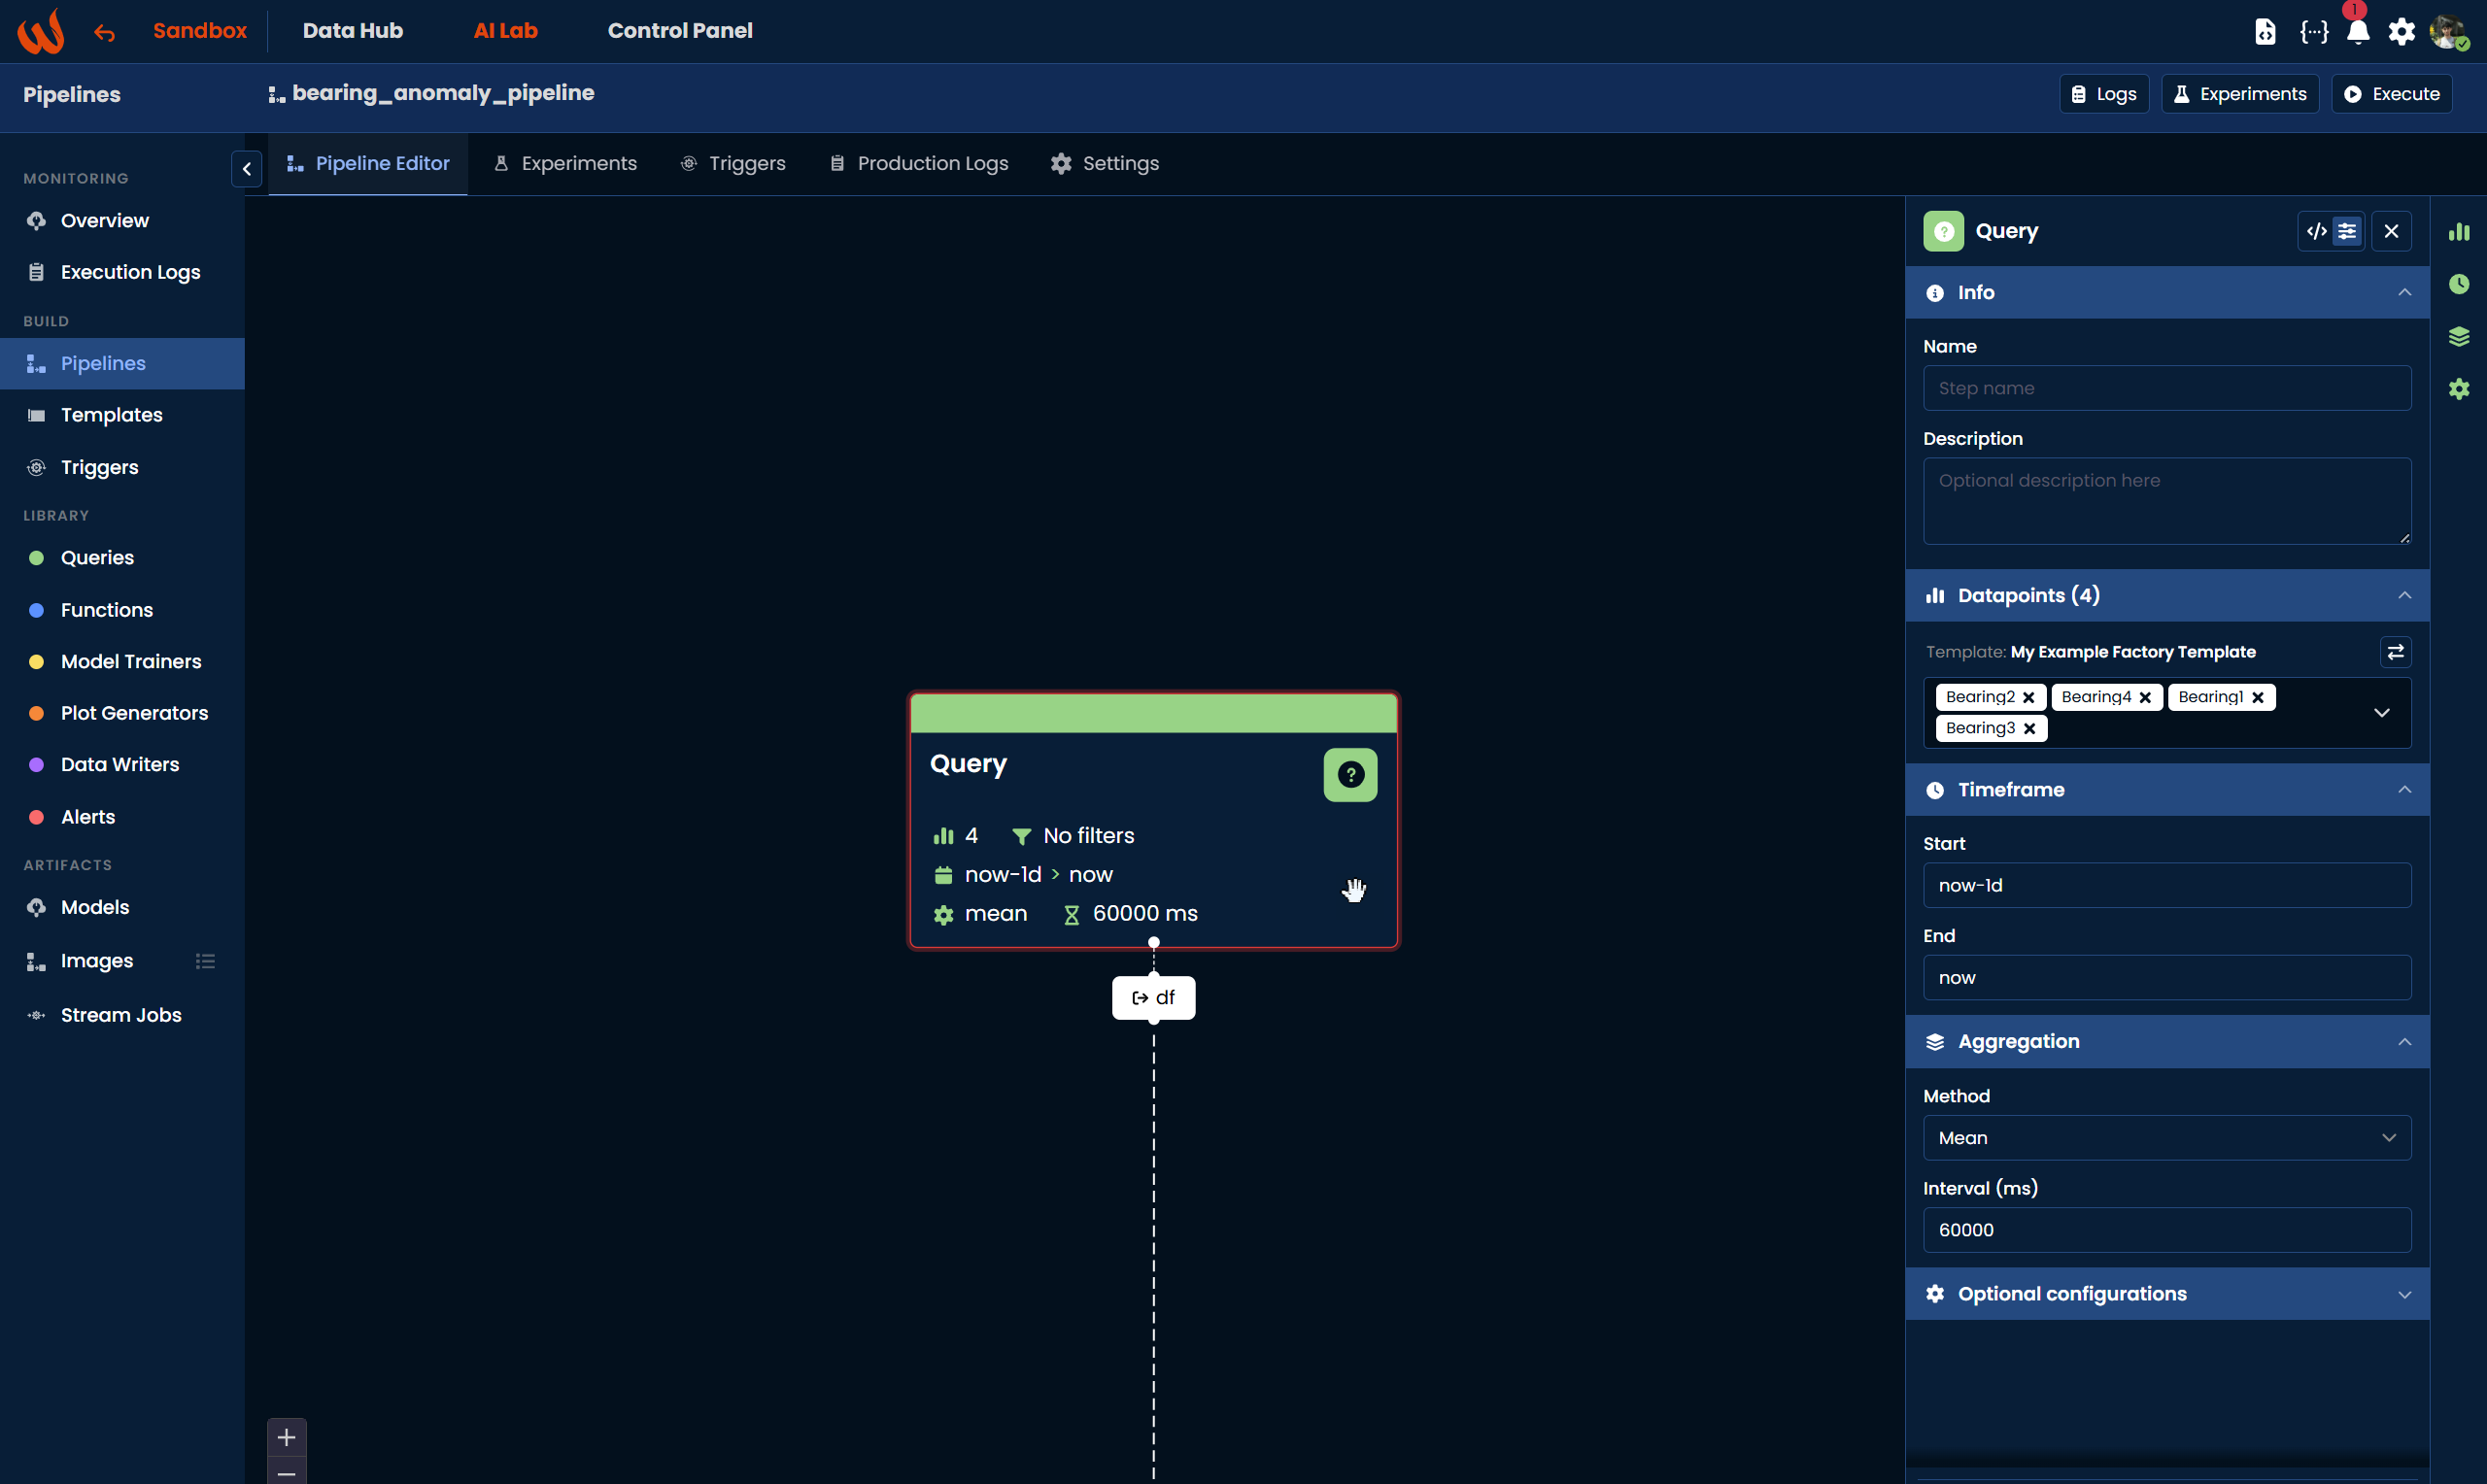
Using the Python Toolkit, add a query step to the pipeline using pipeline.add_query():
pipeline.add_query(
    wizata_dsapi.Request(
        datapoints=["Bearing1", "Bearing2", "Bearing3", "Bearing4"],
        start="now-1d",
        end="now",
        agg_method="mean",
        interval=60000
    ),
    df_name="query_output"
)
The key parameters are:
datapoints: the list of datapoints or template property names to query.start / end: the time window to retrieve. Accepts fixed datetimes, epoch timestamps, or relative expressions likenow-1d.agg_method: the aggregation method applied within each interval. Common options aremean,min,max, andsum.interval: the aggregation interval in milliseconds. For example,60000produces one data point per minute.df_name: the name assigned to the output dataframe, used to reference it in subsequent steps.
pipelinebeing the pipeline object already defined. For the full list of available parameters, refer to the SDK Request reference.
Define the Timeframe
The timeframe of a query can be defined in three ways:
- Fixed: using an explicit
start/endas a datetime or epoch timestamp. - Relative: using
now-based expressions likenow-1hornow-7d. By default,nowis set to the moment the pipeline was queued. - Variable: using a custom
@variablethat can be overridden by the user at execution time, or set once on the deployment so every scheduled run receives it.
For more details on query options, filters, and advanced configurations, refer to the Query article.
Events — query by batch or status
When the twin carries event datapoints — batches, production orders, machine states — the Query step can shape its result around those events instead of the clock: one window per batch, or every window of a status, with the aggregation computed inside each window.
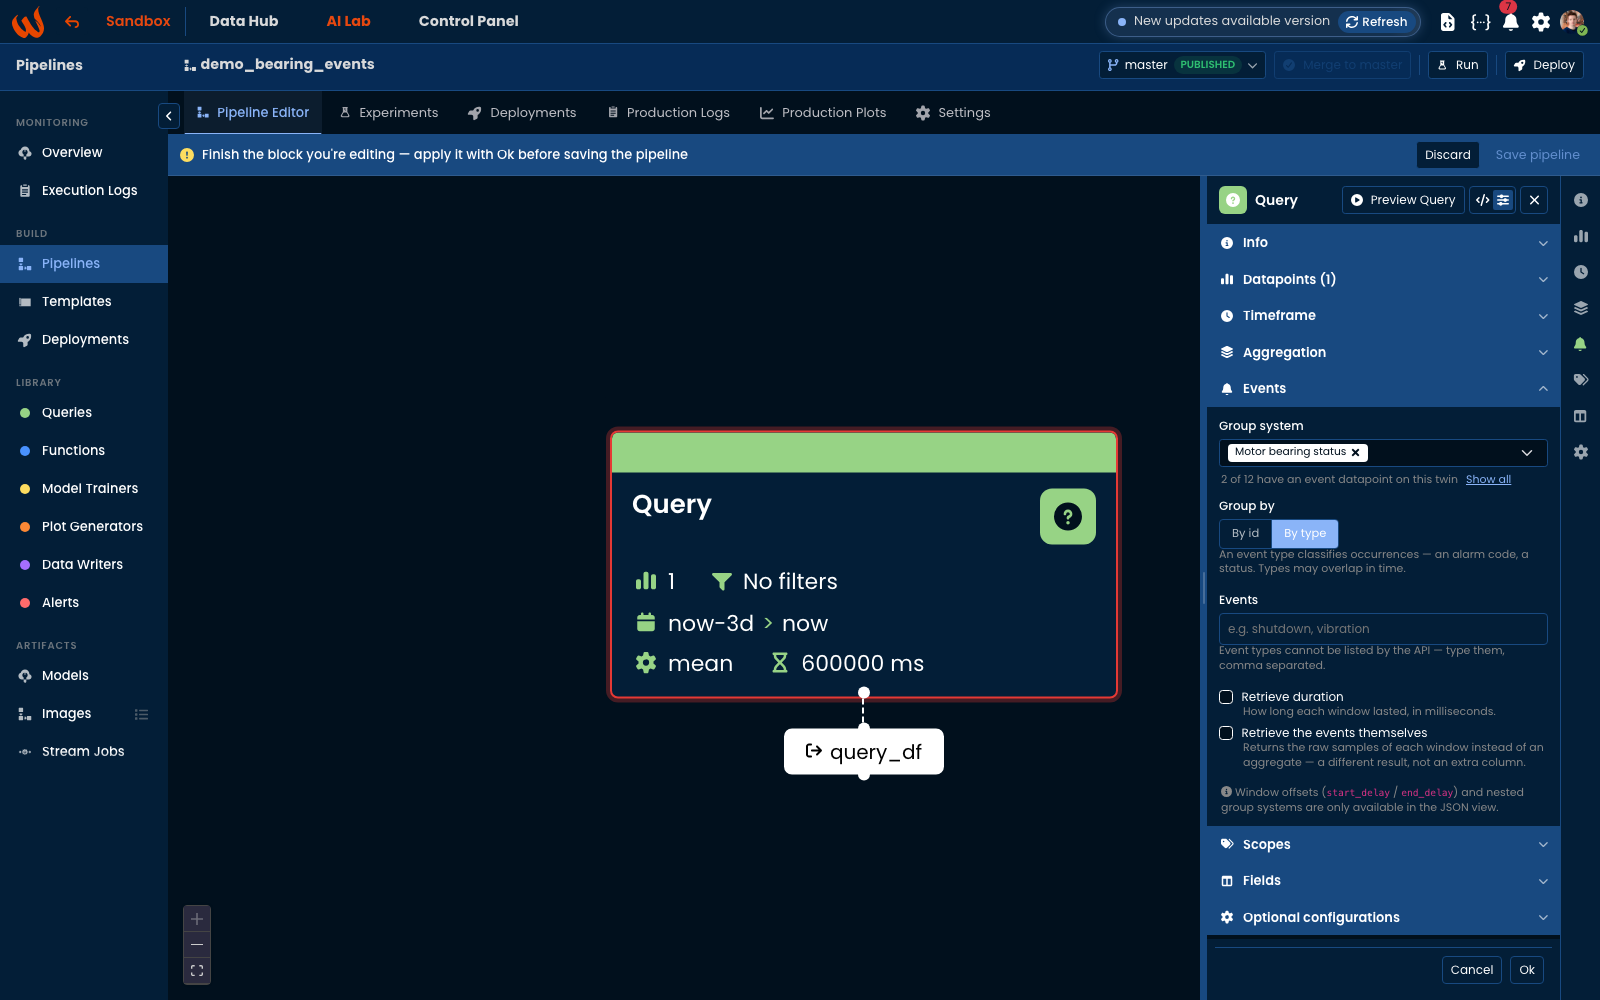
Using the Pipeline UI, open the Events section of the block:
- Group system — pick the event system to group by. The list offers the systems that have an event datapoint on the twin of your datapoints; Show all lists every system of the tenant.
- Group by — By id treats each event as one occurrence (a batch, a tracking number) and returns one group per event id. By type groups by the event's type (a status such as
normal,vibration,shutdown) and returns every window of that type, which may overlap in time. - Events — leave the box empty to take all windows in the timeframe. By id, Load available event ids lists the ids present over the query's timeframe so you can pick one or several. By type, type the types you want, comma separated — the platform does not list event types.
- Retrieve duration — adds how long each window lasted, in milliseconds.
- Retrieve the events themselves — returns the raw samples of each window instead of an aggregate. This is a different result, not an extra column: use it to look inside a batch, not to summarise it.
The Aggregation section still applies, inside each window: Mean with an interval of 600000 gives one value per 10 minutes within every window; Mean with the interval left empty gives one value per window; Raw (none) returns the samples. When asking for durations only, untick Value in the Fields section so the result carries the durations alone.
Window offsets (start_delay/end_delay) and nested group systems — statuses inside a batch — are available in the block's JSON view only. Switch with the{ }button, edit, and switch back to the form to preview.
Using the Python Toolkit, the same query is a group on the request:
pipeline.add_query(
    wizata_dsapi.Request(
        datapoints=["mt1_bearing1"],
        start="now-3d",
        end="now",
        agg_method="mean",
        interval=600000,
        group={"system_id": "bearings_status", "group_by": "type"},
        field=["duration"],          # optional: the windows' durations
    ),
    df_name="bearing_by_status"
)
The result is indexed by event id (or type) and time. The structure of the groups, the shape of the frames and worked examples are in Querying Event datapoints.
Preview Query
Preview Query, in the header of the configuration panel, runs the block exactly as configured — datapoints, timeframe, aggregation, events, scopes, fields — and shows the result as a chart, a table, or both side by side. Nothing is saved: preview as often as you like while shaping the query, then Ok to apply the block and Save pipeline.
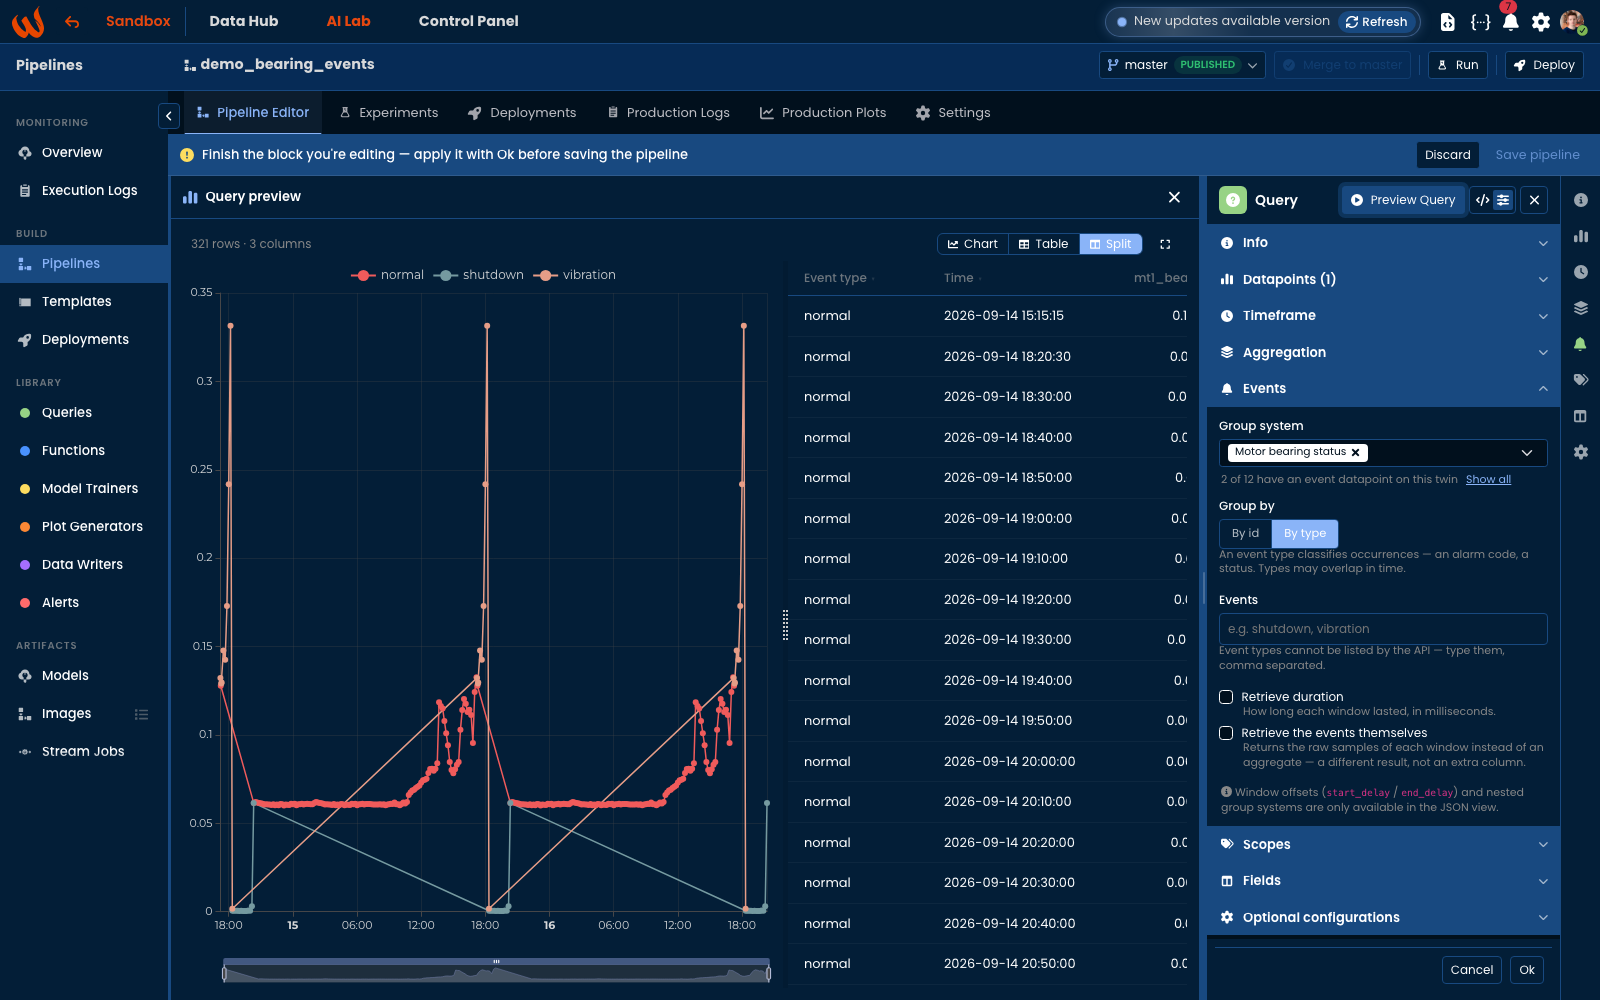
The preview reads the same endpoint the pipeline will use at run time, so the columns you see — including the event id or type column of a grouped query — are the columns the next step receives.
Output
Once the Query step runs, it produces a dataframe named after the df_name parameter. This dataframe contains one column per requested datapoint and one row per aggregation interval within the specified timeframe. It is then passed to the next step in the pipeline via a named output block.
Configuring the Output Block
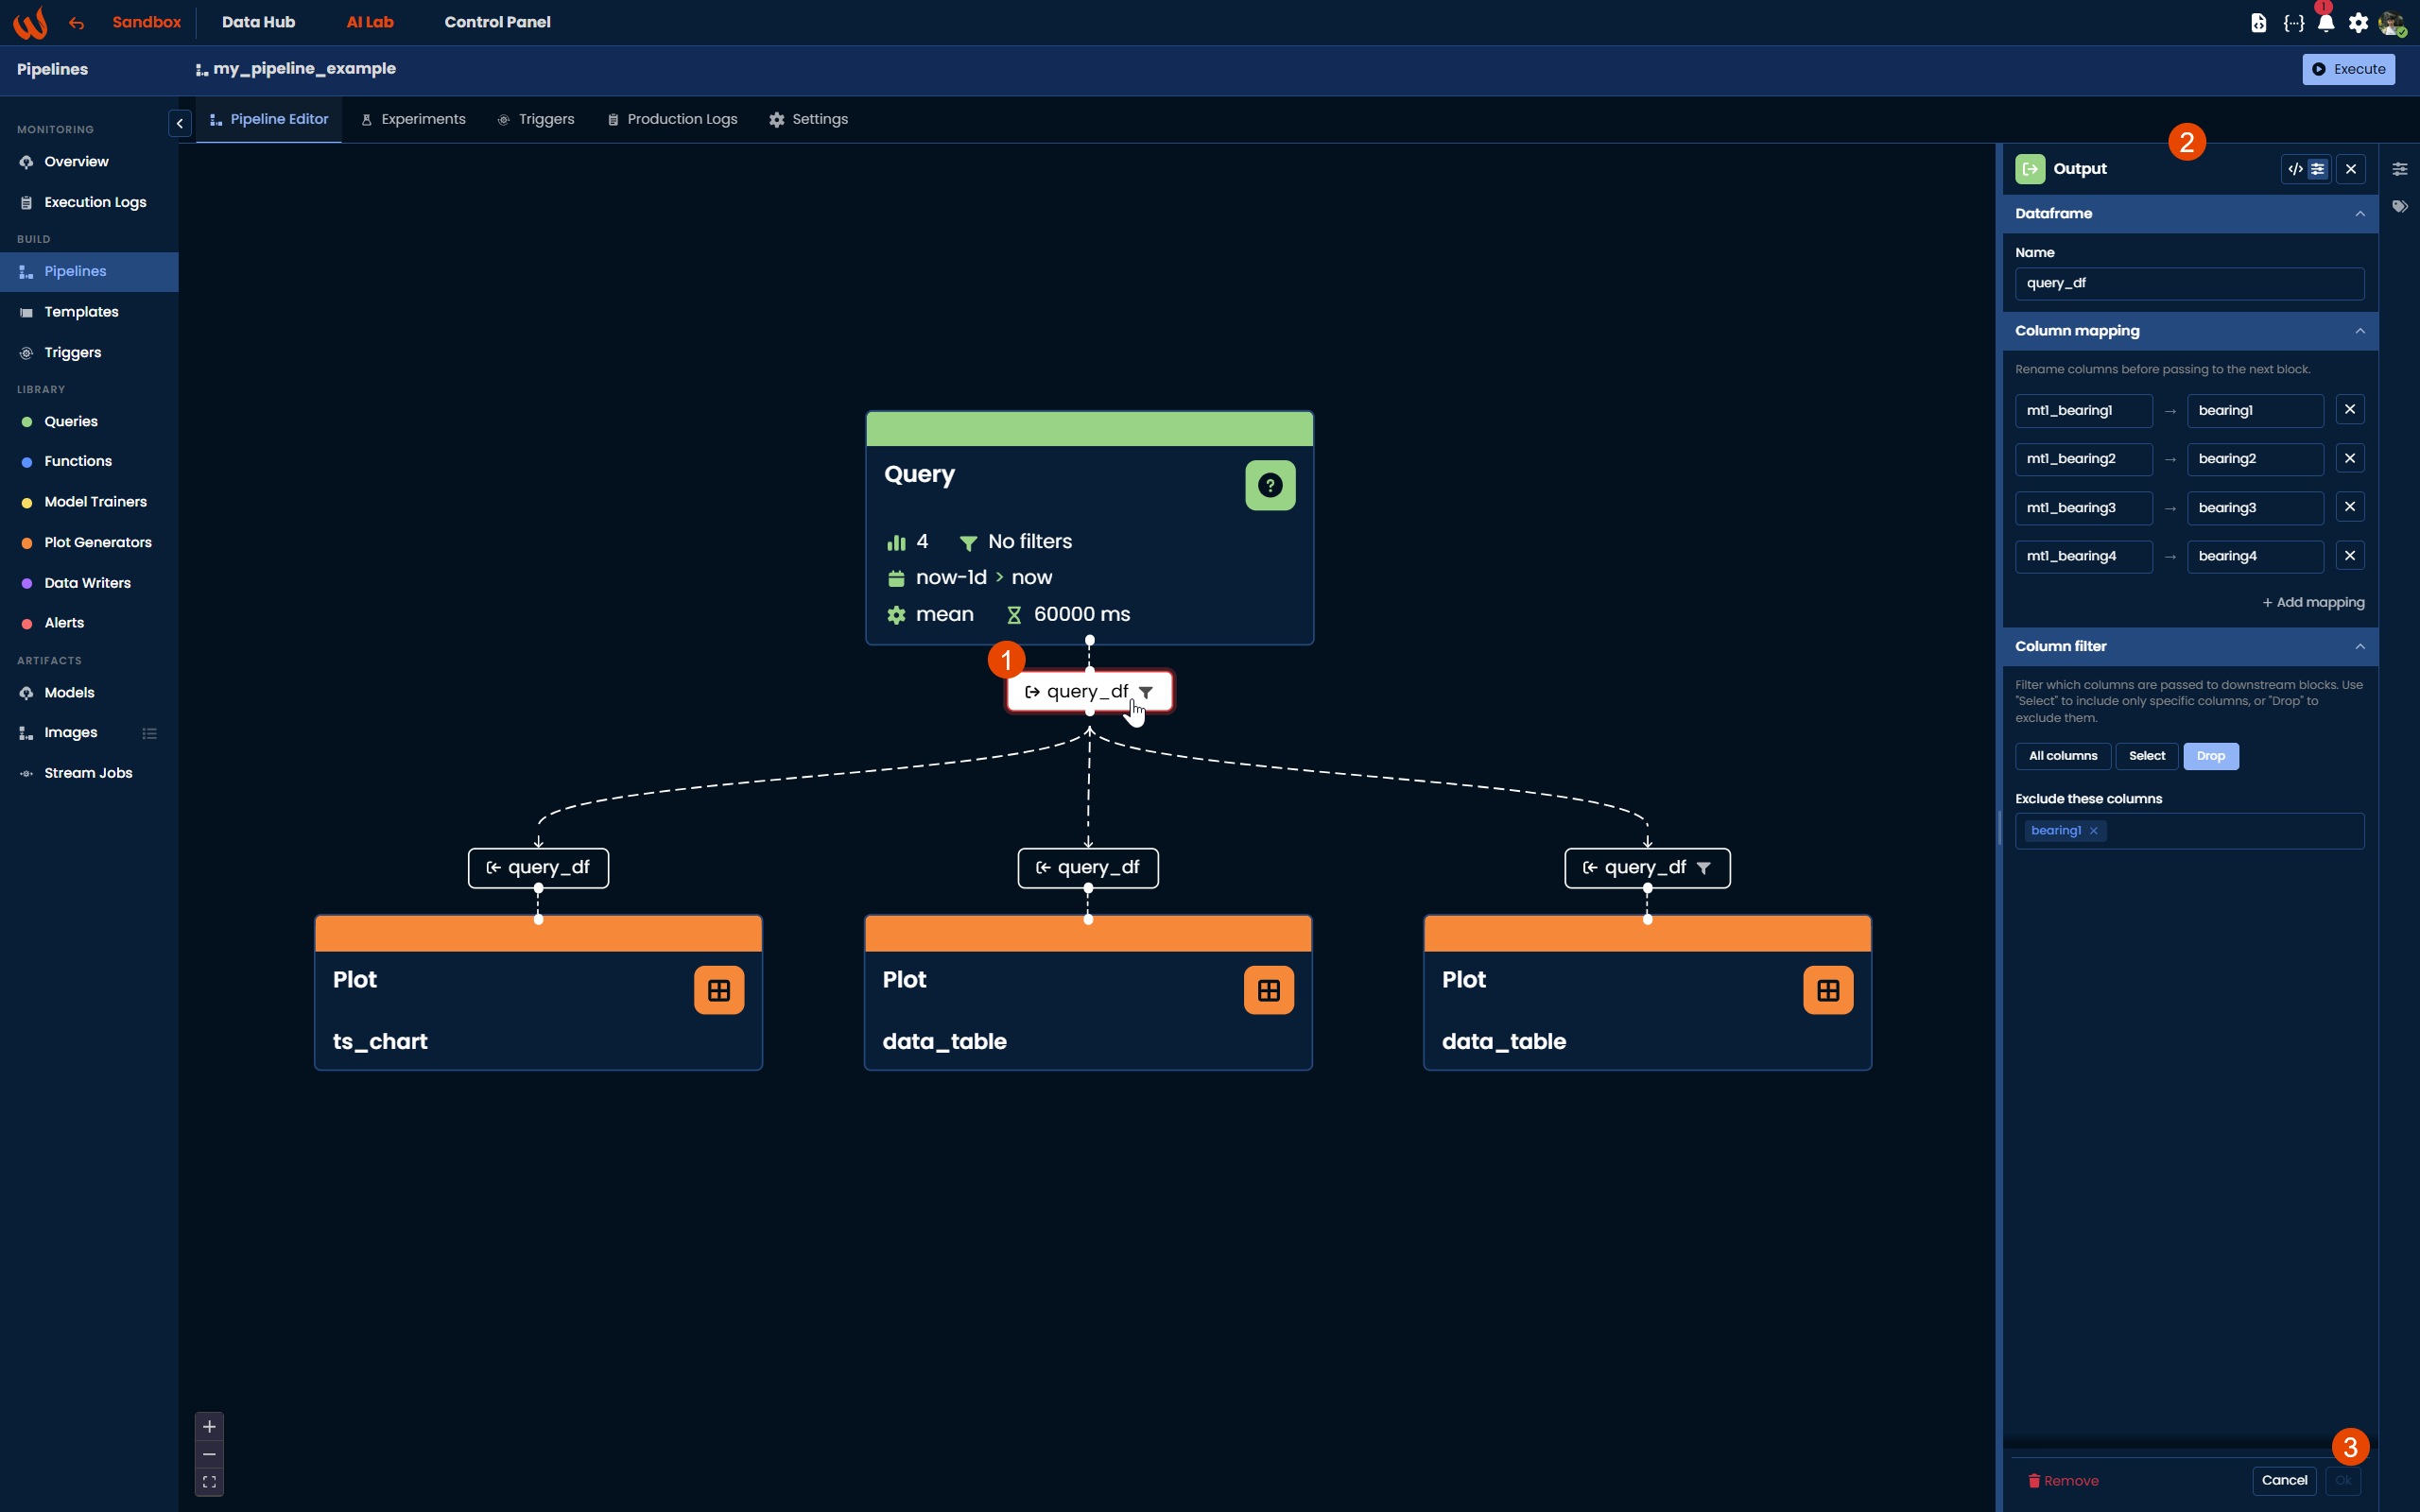
When working in the Pipeline UI, you can click on the output block to open its configuration panel. This gives you two additional options to control how the dataframe is passed to the next step.
Column Mapping
Column mapping allows you to rename columns before they are passed to the downstream block. This is useful when the column names produced by the query do not match what the next step expects. For example, if your query returns mt1_bearing1 but your preprocessing script expects Bearing1, you can define the mapping here without modifying the script itself.
Each mapping entry follows the format source column → target column. You can add as many mappings as needed using the + Add mapping button.
Column Filter
Column filter allows you to control which columns are passed to the next block. There are three modes:
- All columns (default): all columns from the dataframe are passed through.
- Select: only the columns you specify are passed through, dropping the rest.
- Drop: all columns are passed through except the ones you specify.
This is useful when your query returns more columns than the next step needs, helping you keep the dataframe clean and avoid processing unnecessary data.
Updated 20 days ago