
Link your Grafana environment to Wizata
To start taking advantage of the Grafana integration within the platform, we first have to make the initial configuration. In this section, we’ll guide you through the steps required to successfully connect your Grafana environment to Wizata.
Creating the custom.ini file
Begin by configuring a service account token with Editor permissions within your Grafana environment. Then, set up a custom.ini file with the necessary options:
[grafana]
api=https://<your_url>/
key=<your_key>
folder_uid=abc093b5-922c-40b2-bb96-303da02b3ef5
You can create a .txt file using a text editor and then saving it with the name custom.ini.
If you don't already have a Grafana service account token, you will need to create one. You can refer to the official Grafana documentation article for more information.
Note: folder_uid is optional. It allows you to specify the folder where generated dashboards will be stored within Grafana.
Uploading the file to the platform
Once your custom.ini file is properly configured, upload it to the platform to finalize the setup. To do this, click on the settings icon -> preferences and scroll down to the custom_ini option under Pipeline Settings. Select upload file and browse for your custom.ini file on our PC.
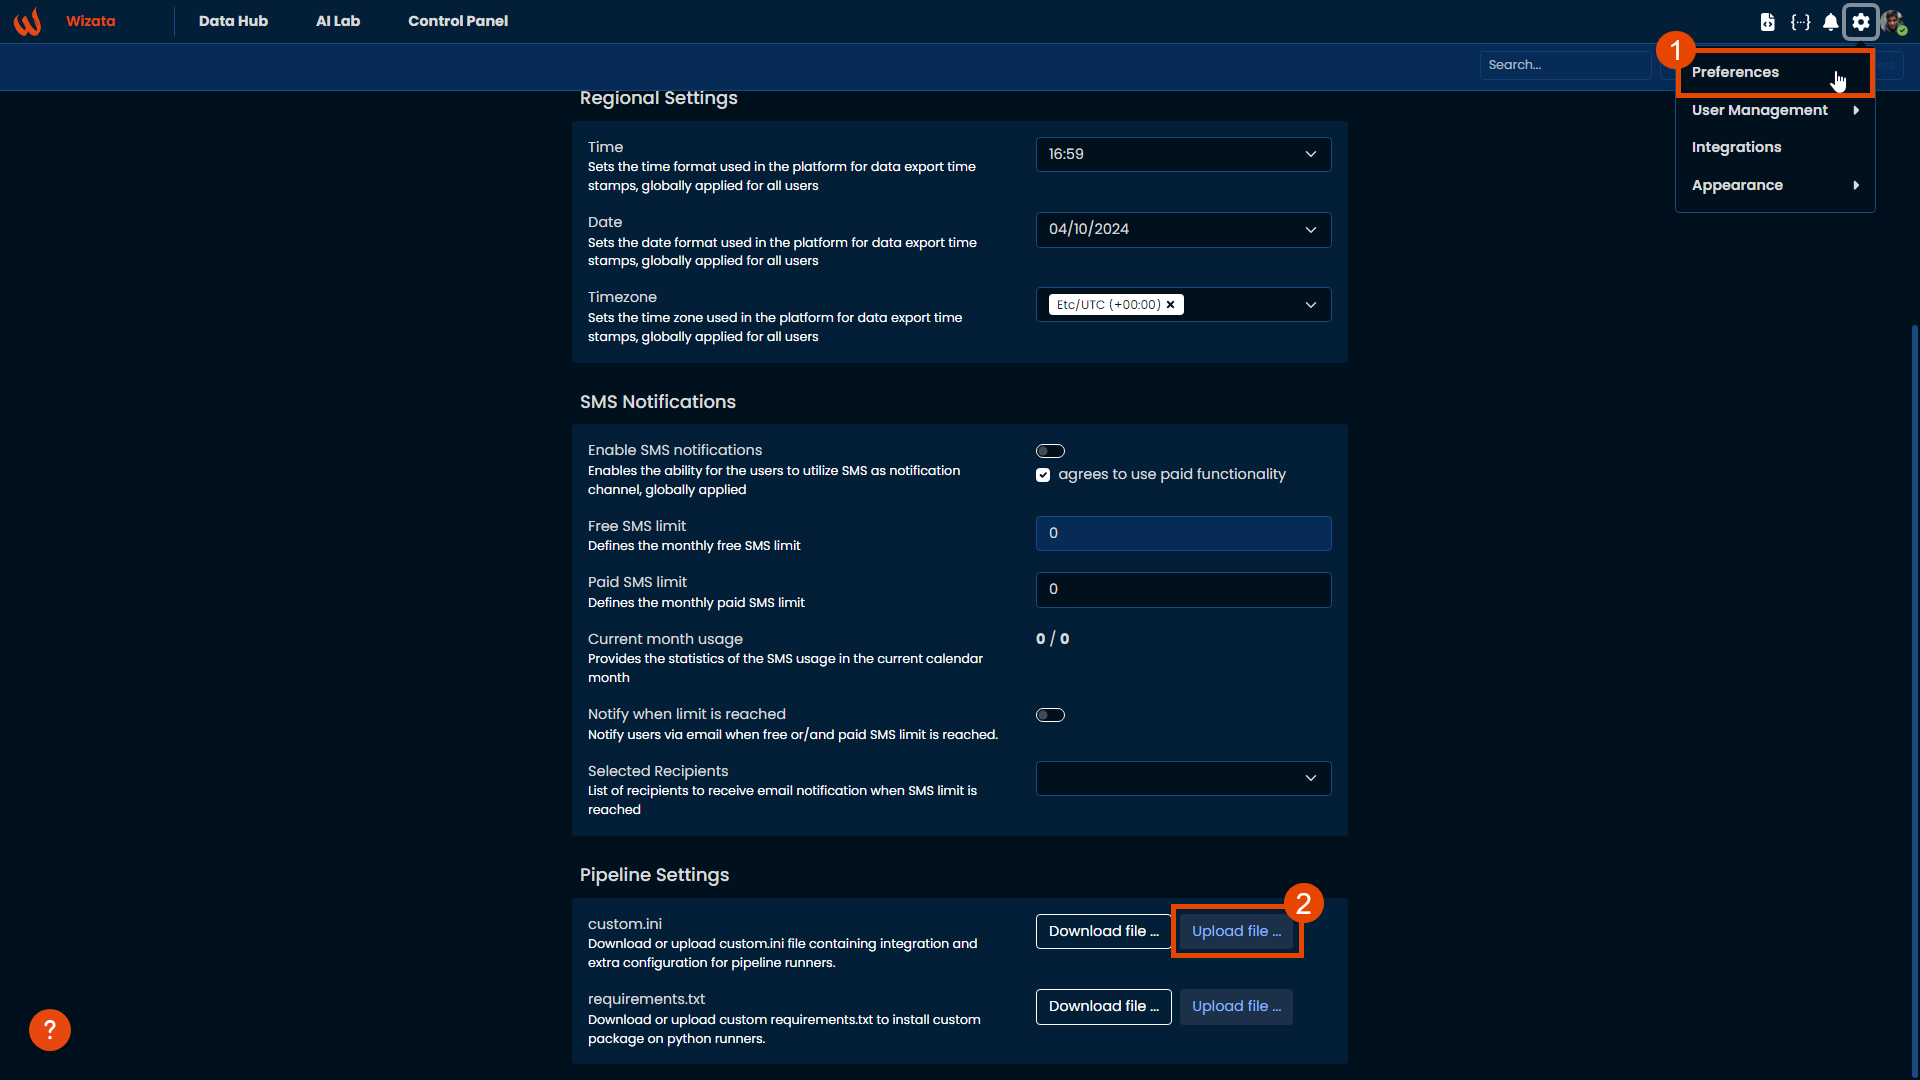
Backup custom.ini before editingIt is recommended to always download custom.ini and apply modification to it before uploading a new one as you might erase potentially existing configuration.
Pipeline
Once the configuration is complete, you can access the Grafana API using a script within a Pipeline.
From release 12.1,context.grafana_apirequires the optional grafana-client libraryAdd it to your own requirements to use the examples below:
grafana-client>=3.5.0When it is not installed,
context.grafana_apiisNoneand a notice is written to the execution logs.
Here is a simple example script to search for all the dashboards in our Grafana environment:
def your_script(context: wizata_dsapi.Context):
    context.grafana_api.search.search_dashboards(query="")
For instance, we can also retrieve the dashboard created in the Grafana Dashboard article, which contains data from the motor's bearings, and update its title using the following logic:
def script_logic(context: wizata_dsapi.Context):
    example_dashboard = context.grafana_api.search.search_dashboards(query="My example dashboard")

    if example_dashboard:
        dashboard_uid = example_dashboard[0]['uid']

        dashboard = context.grafana_api.dashboard.get_dashboard(dashboard_uid)

        dashboard['dashboard']['title'] = 'My example dashboard updated'

        context.grafana_api.dashboard.update_dashboard({
            "dashboard": dashboard['dashboard'],
            "overwrite": True
        })
For more information about the
contextobject, refer to our Python SDK documentation
And then, you can execute your Pipeline to apply the changes in your Grafana environment.
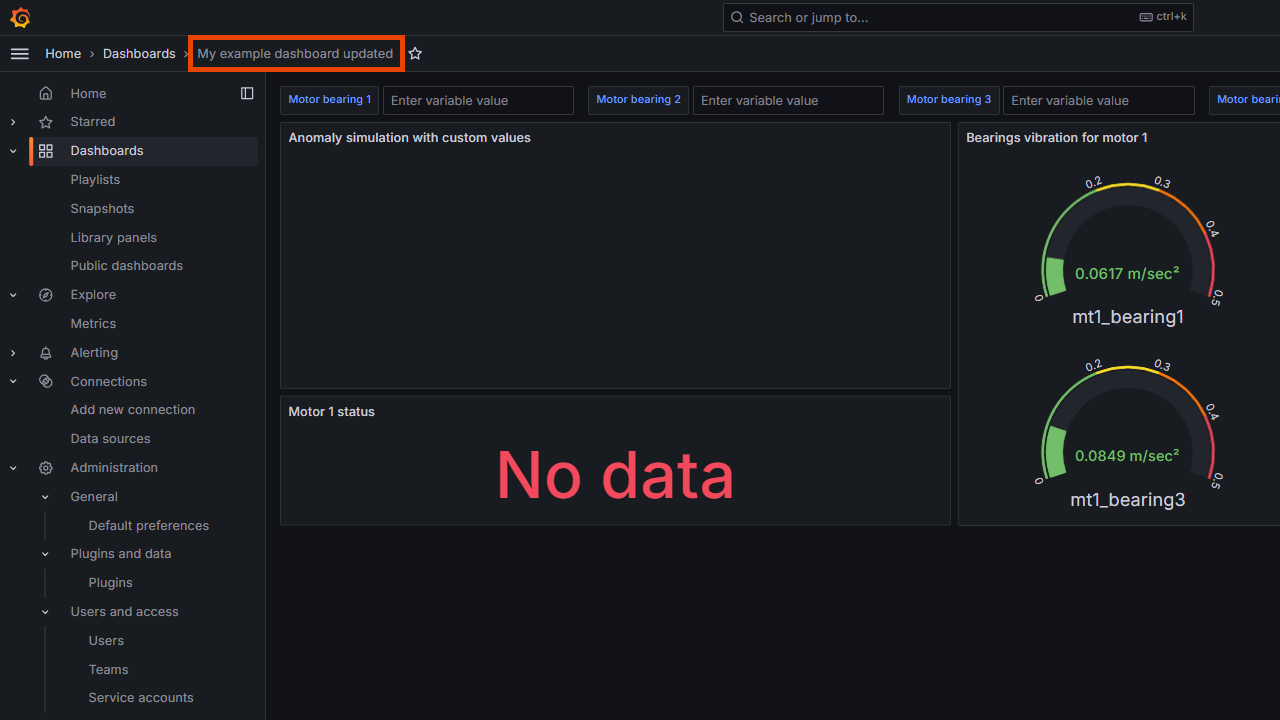
Wizata uses the optional grafana-client (>=3.5.0), installed on your sideIt is not shipped with the platform, because it replaces the HTTP layer used by every other integration. Dashboards, panels, variables and datasources are also available without it, through the platform's own Grafana endpoints.
For more information: Pypi: Grafana-client and Grafana: http_api
Updated 3 months ago