Exploring data
The platform offers comprehensive experiences for visualizing and analyzing data points. Through its interface, users can explore interactive charts that display real-time information, with the ability to adjust time intervals and add conditions to analyze historical trends and patterns.
The following article serves as a guide to the various options available for visualizing your data within the platform. It highlights the different approaches you can take, and the advantages each method offers. By understanding these options, you can choose the most effective way to gain insights from your data and enhance your decision-making process.
Visualizing data on graphs: Data Explorer
The Data Explorer allows you to apply specific conditions to the charts, making it easier to identify anomalies or validate hypotheses based on the data. Additionally, you can create and edit data sources directly within the platform, giving you control over how the data is presented and analyzed.
Now that we have our data points on the platform, we can visualize all the information inside them. On the explorer, we will have a view of the vibration data from several motor bearings.
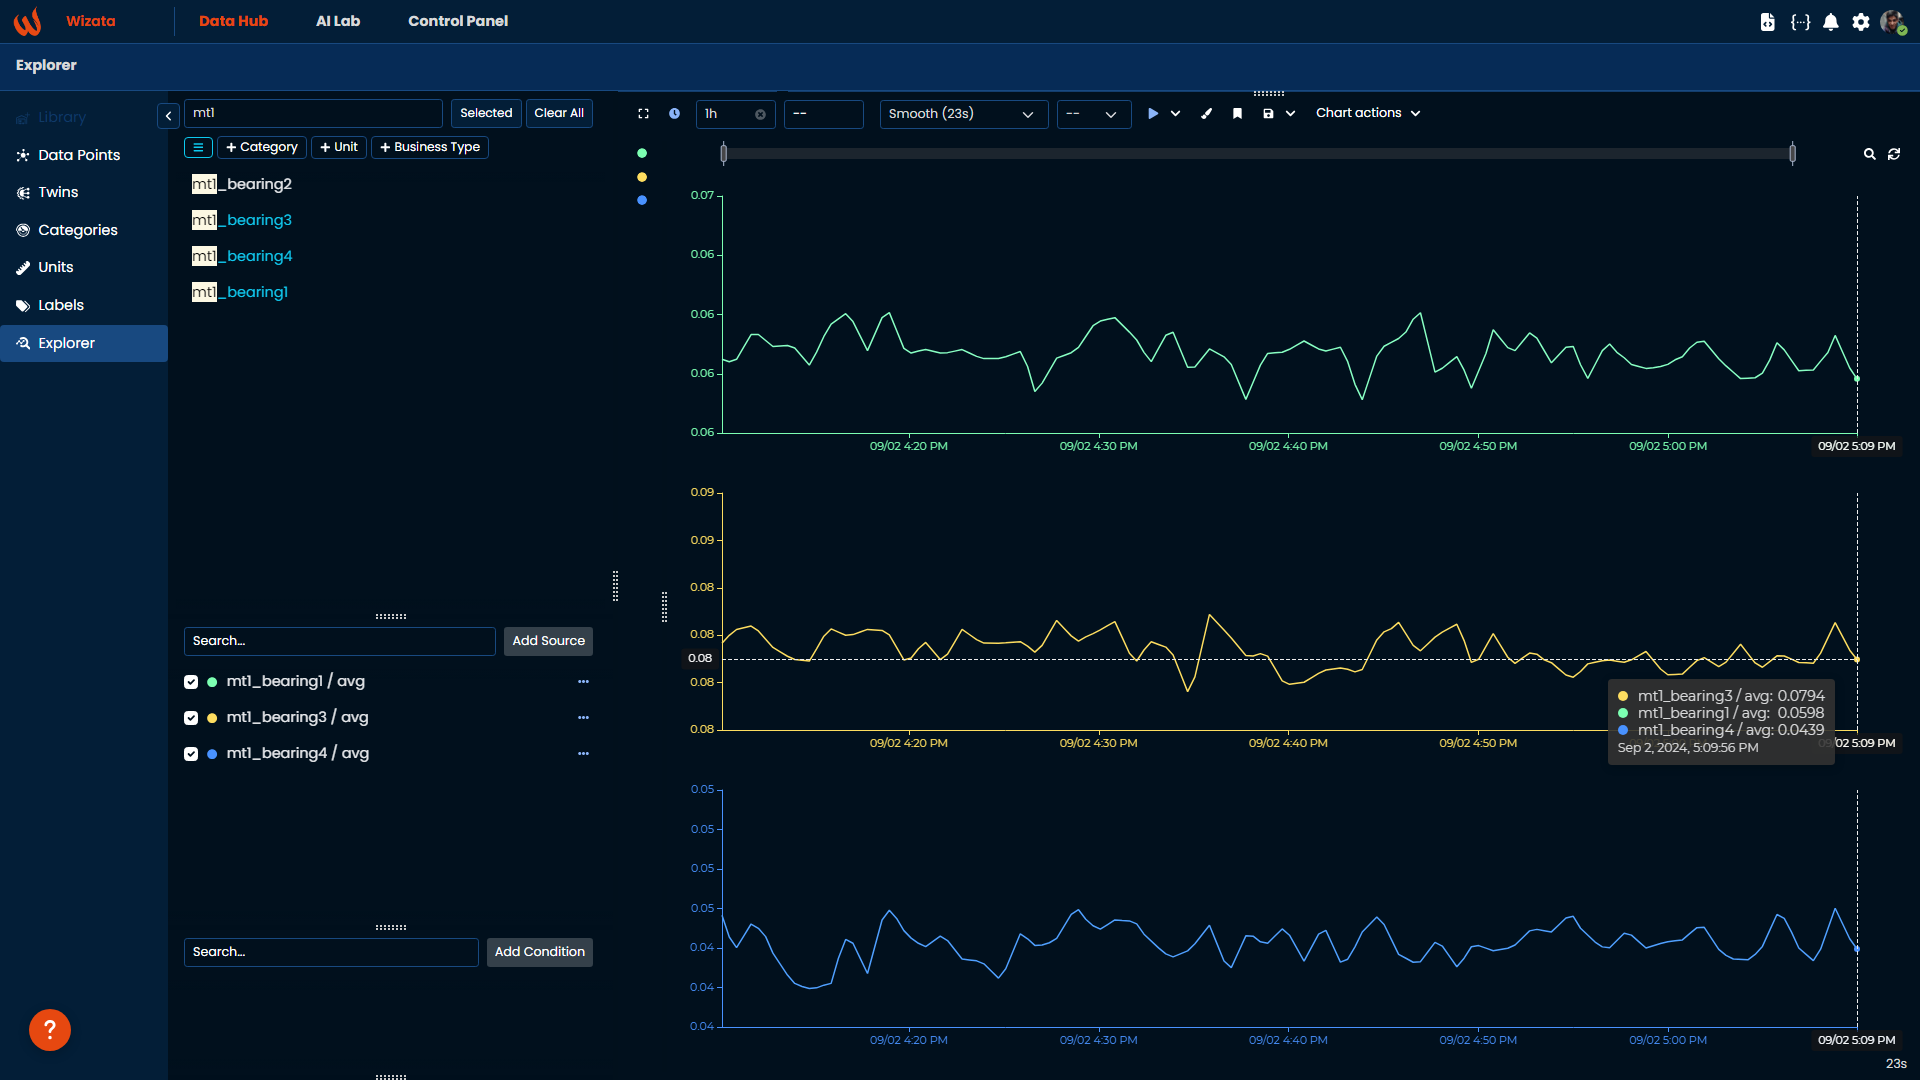
In the main panel, the platform displays time-series graphs of the selected data points. Each line represents the vibration level of a motor bearing over time, with the y-axis showing the vibration amplitude and the x-axis showing the time intervals. You can see the average values for each data point at a particular time, highlighted in the tooltip when hovering over the graph.
Data Explorer allows you to transform your different data sources using various types of graphs and advanced configurations. You can add conditions that will remain visible each time you access a specific graph, modify the time interval and adjust the granularity of the displayed data.
If you want to learn more about the Data Explorer, we have a fully dedicated article where we explain every feature in details
Fetching data: Sample query
In addition to the platform's interactive interface, you can also take advantage of the Wizata DS API to fetch and visualize data points programmatically by customizing certain properties and adding specific conditions. This process, known as a Query, formalizes how to retrieve data from datapoints by applying constraints related to digital twins, certain time intervals, aggregation, and filtering.
In the following example, we will show a simple query using the sample data of our motor's bearings. We will query data for the first motor's four bearings over a 1-day period (from August 18th to August 19th, 2024) with an interval of 60 seconds (60000ms).
The query() method requires a list of datapoints to query, a start and end time, and an interval. It returns a pandas.Dataframe containing the results.
from datetime import datetime
import wizata_dsapi

my_dataframe = wizata_dsapi.api().query(
    datapoints=['mt1_bearing1','mt1_bearing2', 'mt1_bearing3', 'mt1_bearing4'],
    start=datetime.strptime("2024-08-18", "%Y-%m-%d"),
    end=datetime.strptime("2024-08-19", "%Y-%m-%d"),
    interval=60000
)
When we print my_dataframe response in console, it will display the dataframe with the datapoints retrieved within the specified interval:
sensorId                   mt1_bearing1  ...  mt1_bearing4
Timestamp                                ...
2024-08-18 03:00:00+00:00      0.060807  ...      0.043805
2024-08-18 03:01:00+00:00      0.060571  ...      0.043704
2024-08-18 03:02:00+00:00      0.061003  ...      0.044094
2024-08-18 03:03:00+00:00      0.060892  ...      0.044657
2024-08-18 03:04:00+00:00      0.060862  ...      0.045661
...                                 ...  ...           ...
2024-08-19 02:55:00+00:00      0.059822  ...      0.044217
2024-08-19 02:56:00+00:00      0.060386  ...      0.043740
2024-08-19 02:57:00+00:00      0.060210  ...      0.043717
2024-08-19 02:58:00+00:00      0.059926  ...      0.043641
2024-08-19 02:59:00+00:00      0.060255  ...      0.043515

[1440 rows x 4 columns]
Given the depth of the topic, we will delve into the details of how to construct and use queries in another dedicated article, that you can find here
Updated 9 months ago