
Mobile App
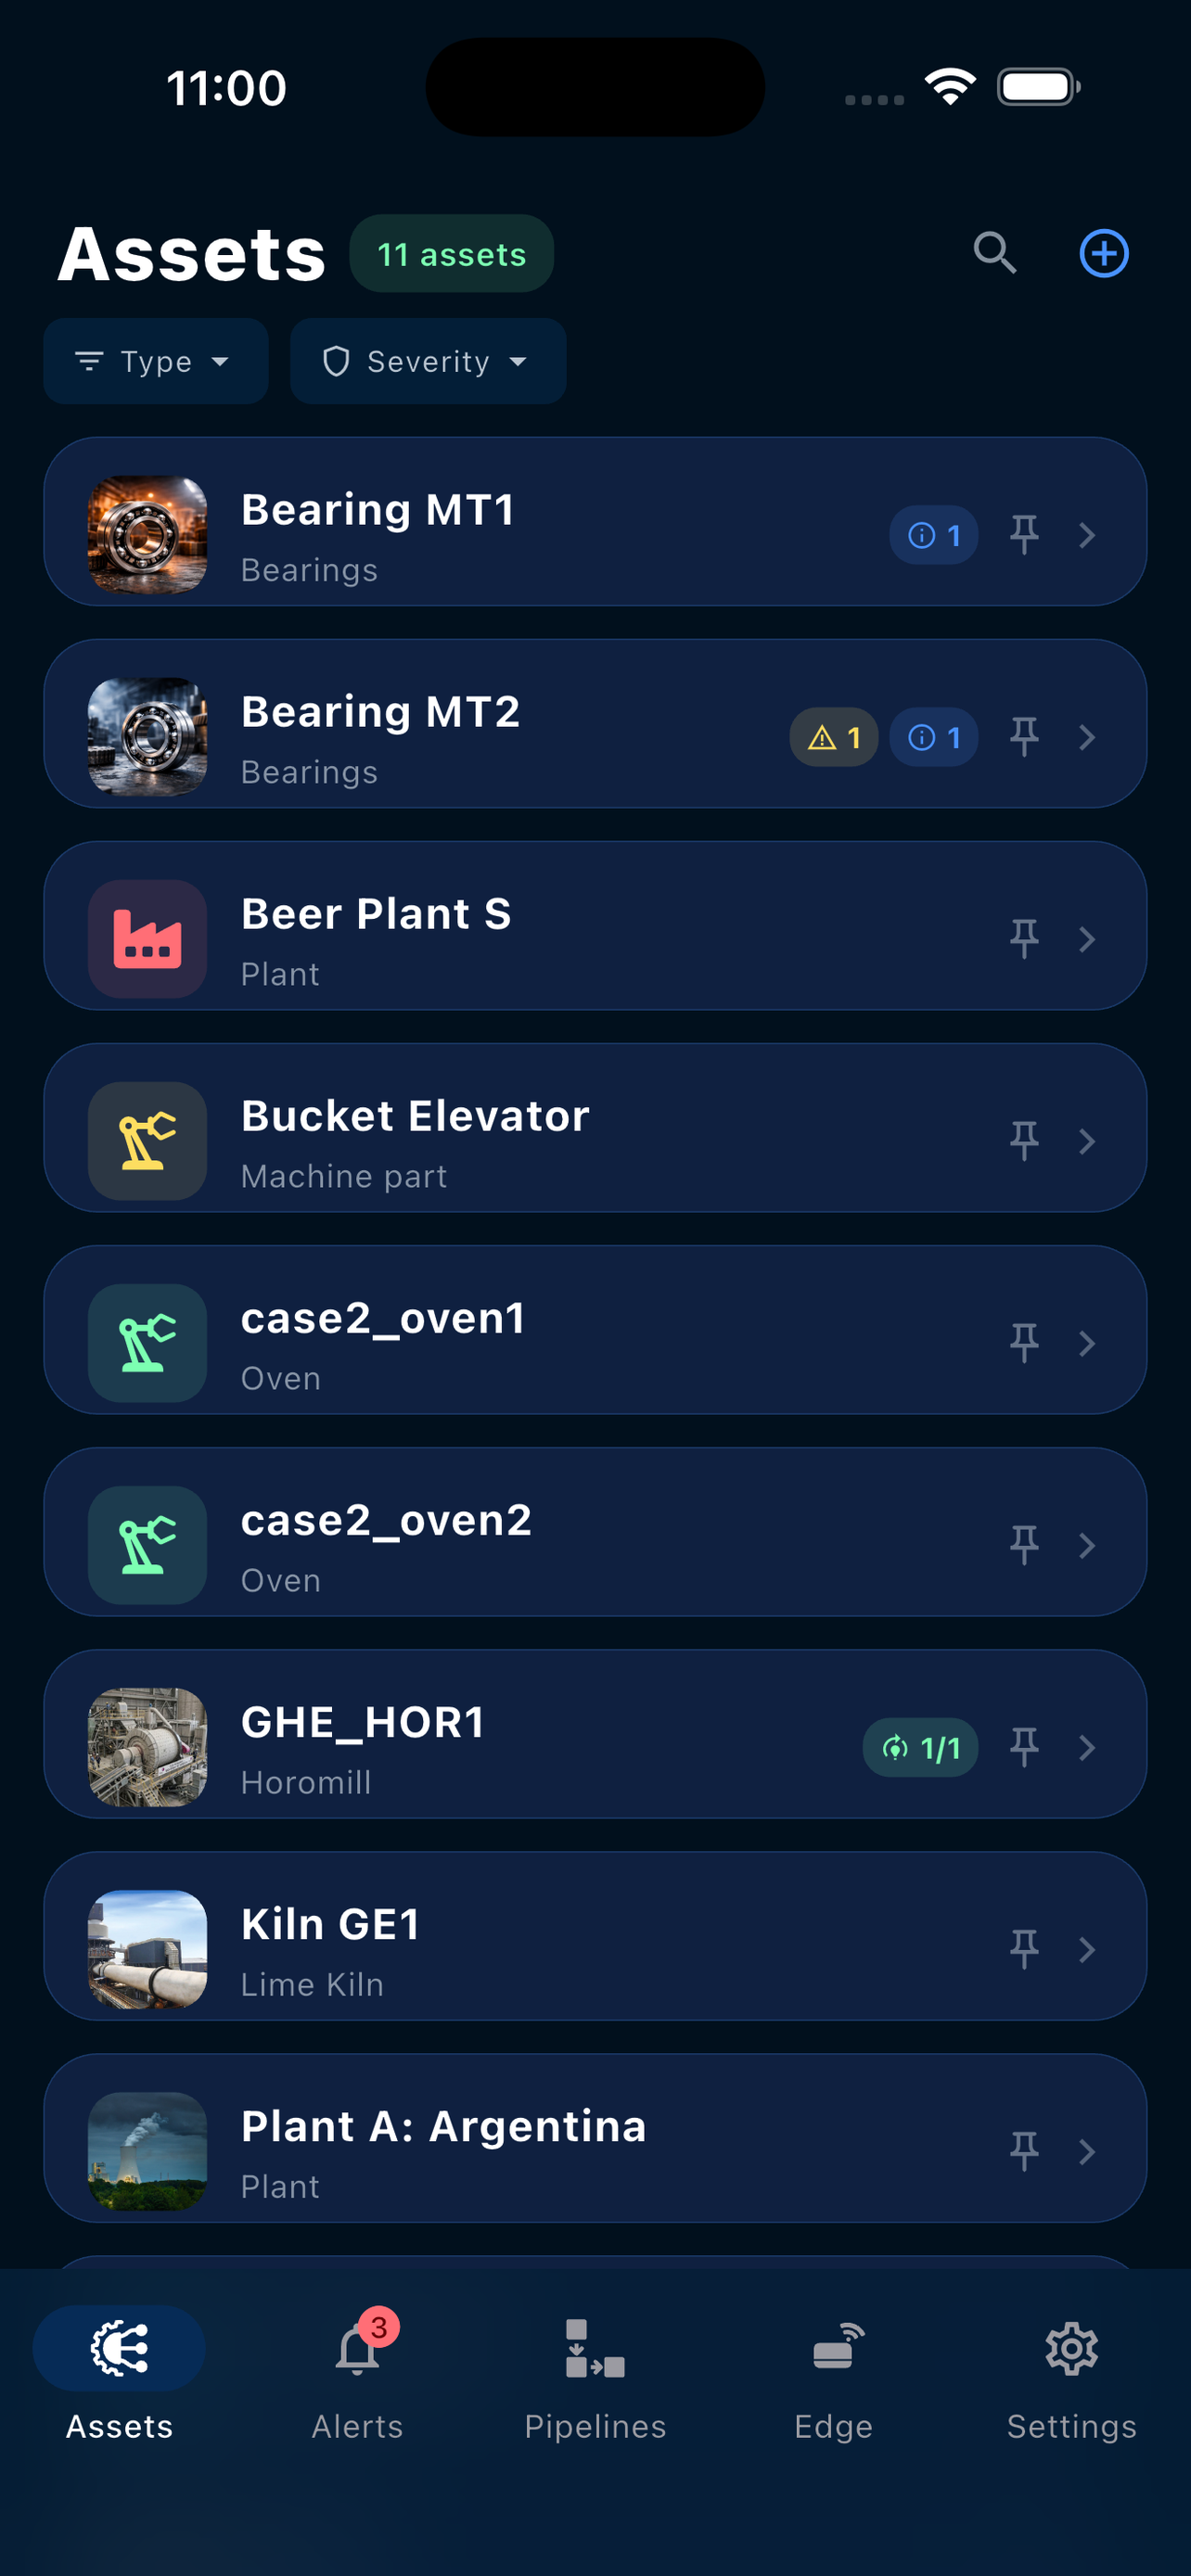
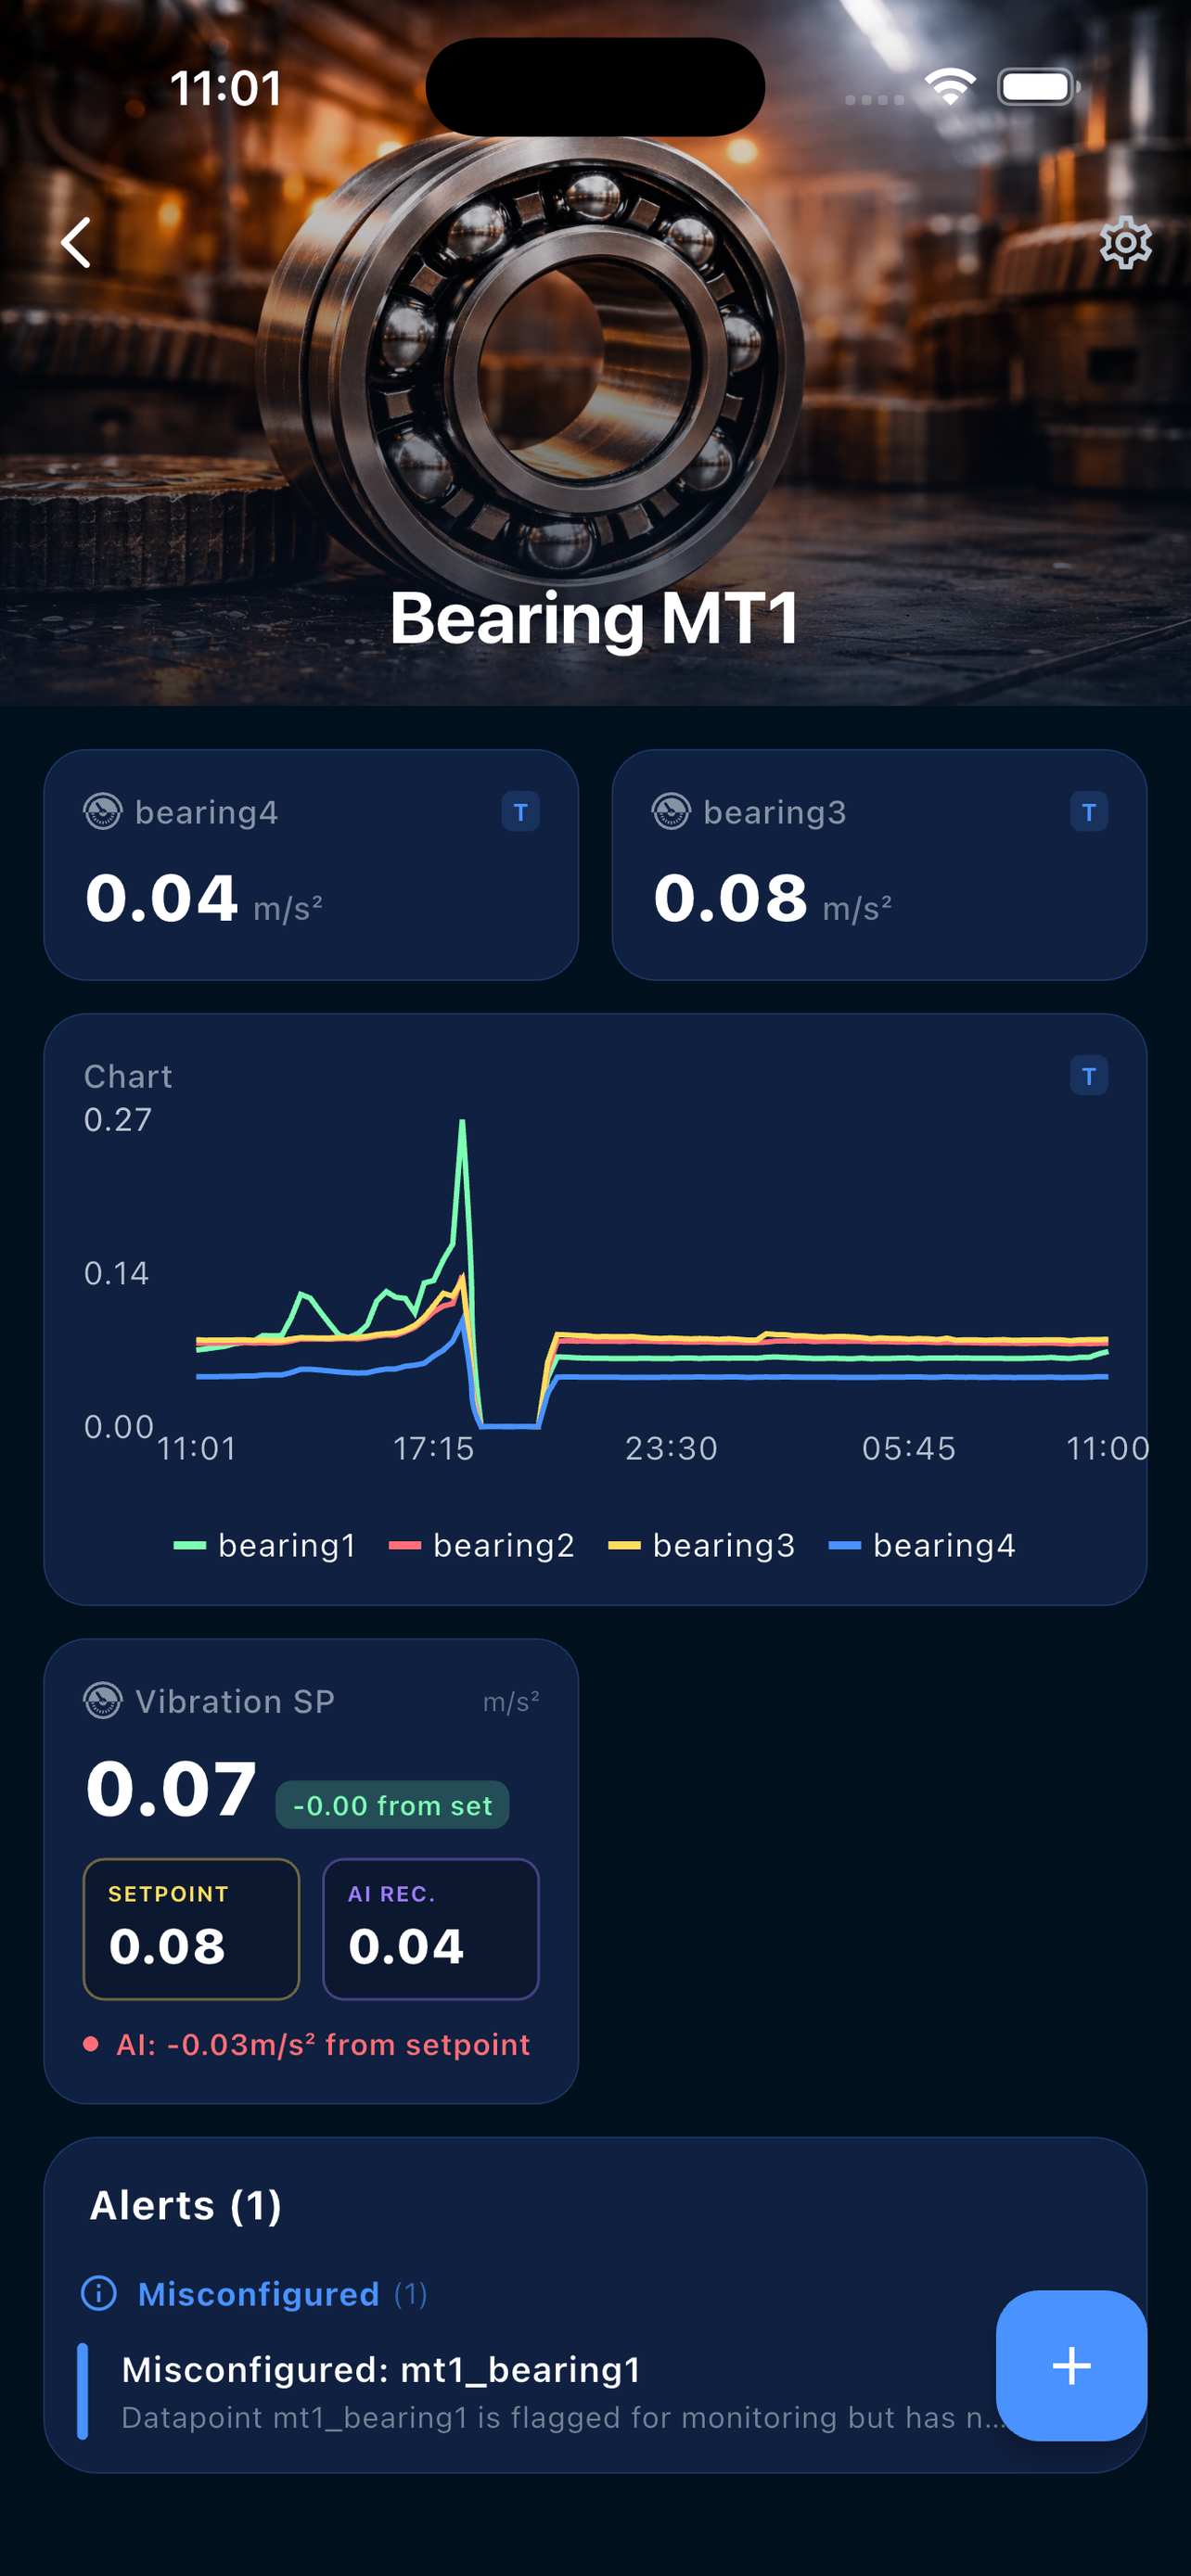
Stay connected to your Wizata environment from anywhere. Live KPI dashboards, real-time alerts, pipeline monitoring, and Edge device status — all secured per Wizata tenant, with native Azure AD sign-in.

Available on iPhone (iOS 16 +) and Android (7.0 / API 24 +).
What you can do
📊 Dashboards — Build per-asset dashboards with sensor tiles and charts. Long-press to rearrange, drag to reorder, edit anytime.
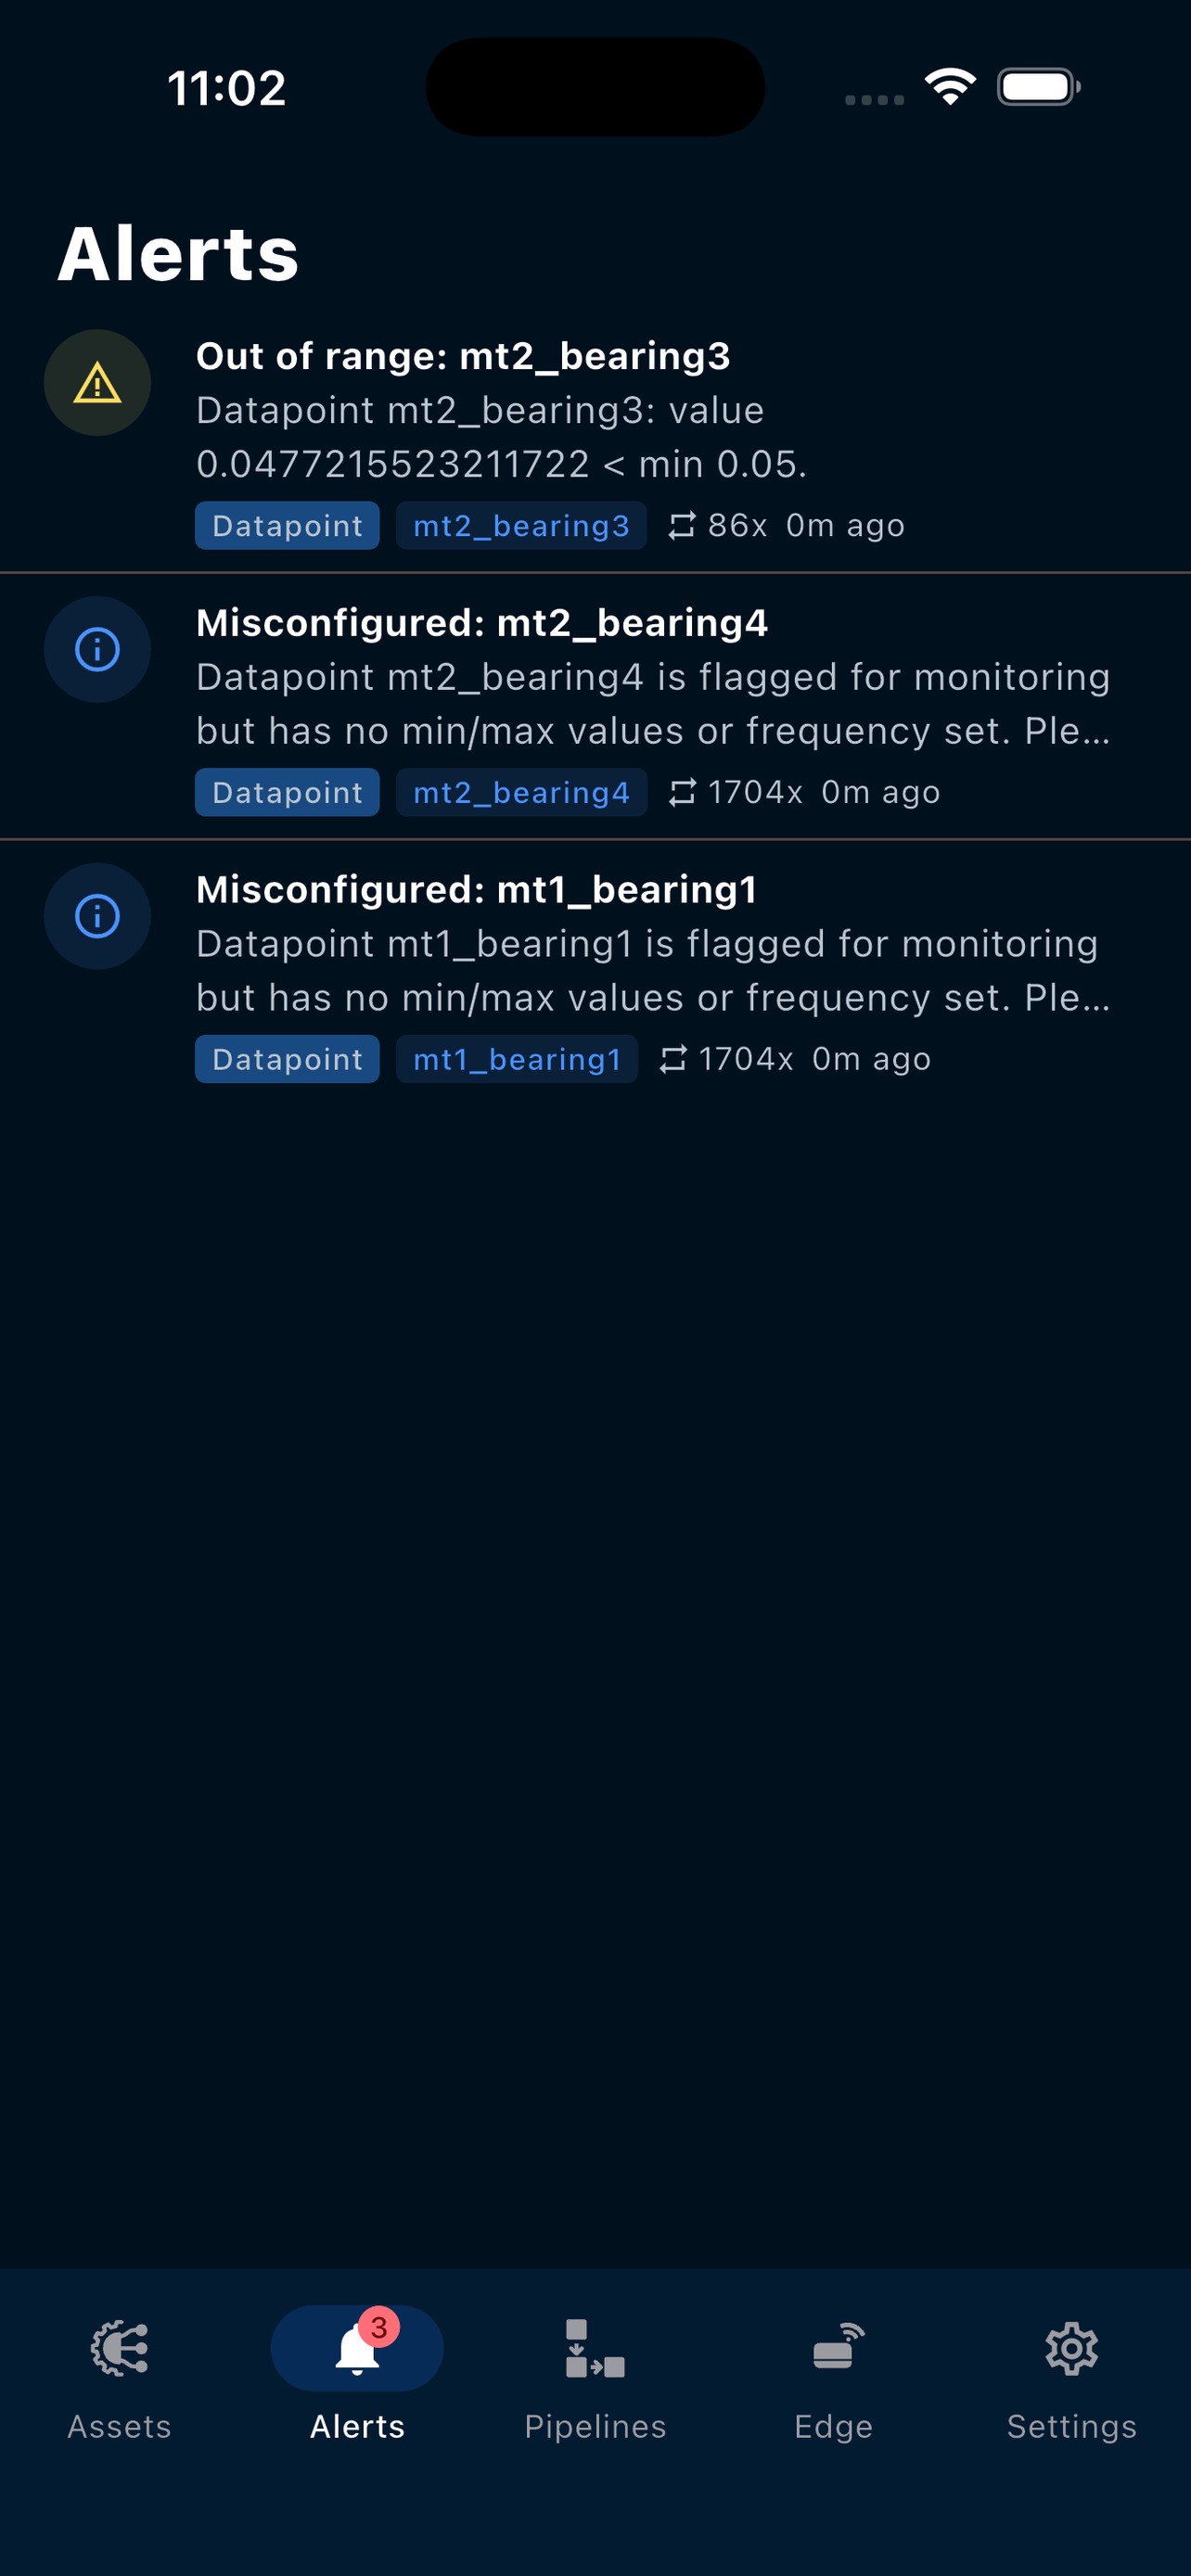
🚨 Alerts — Real-time push notifications when datapoints drift out of range, pipelines fail, or edge devices go offline. Severity filtering and per-scope subscriptions.
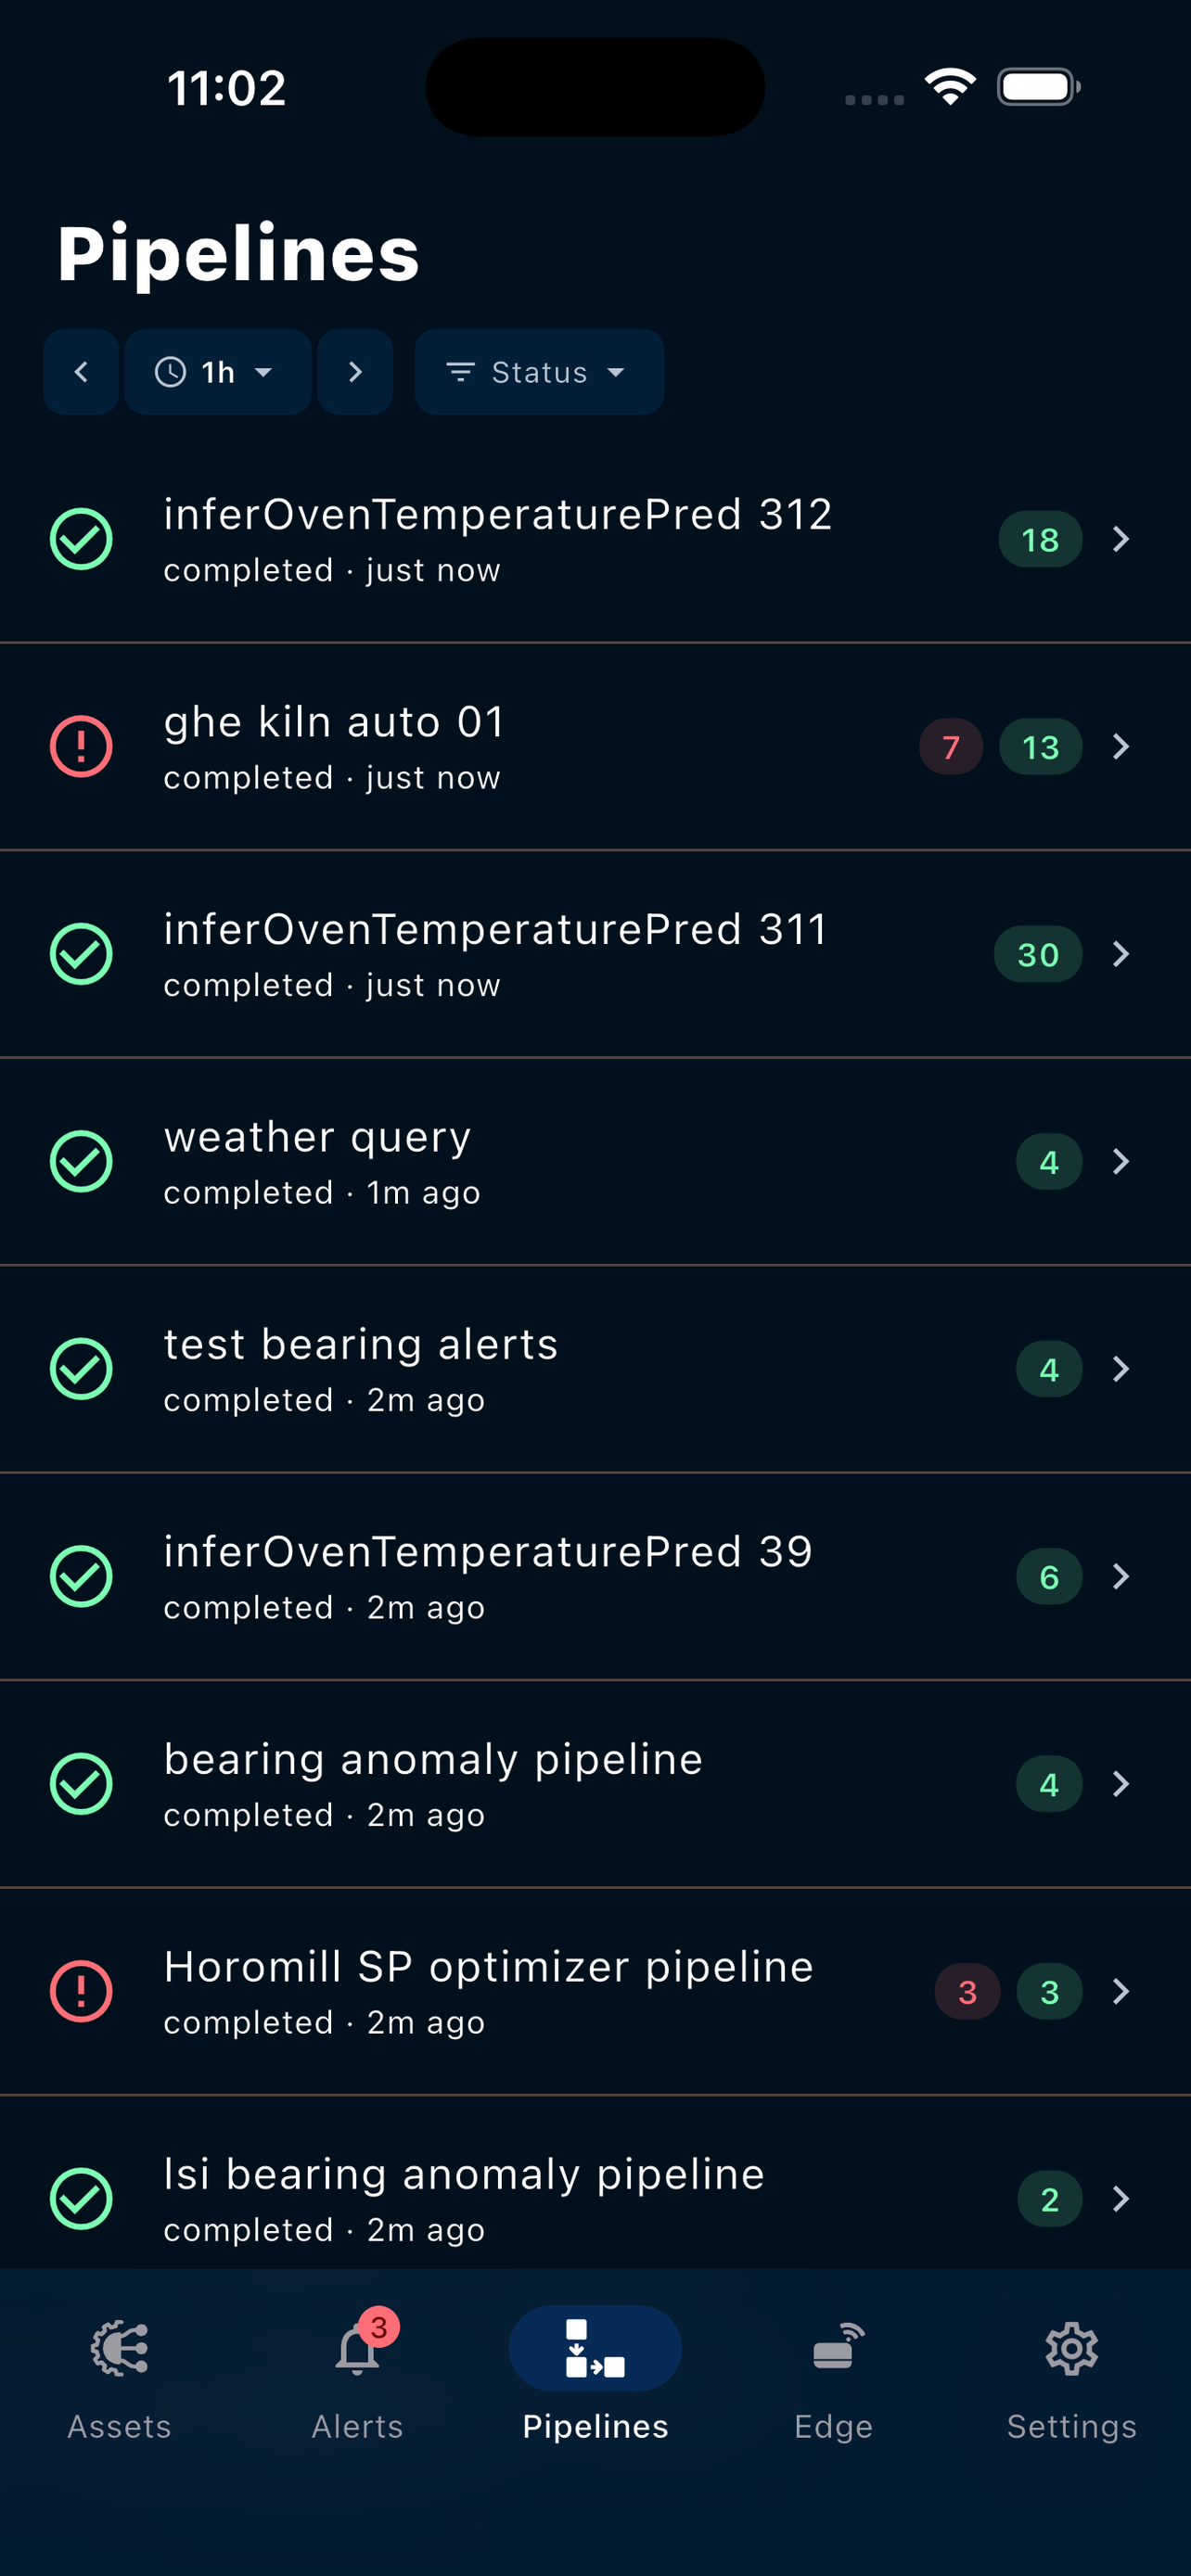
🔧 Pipelines — Monitor pipeline executions live. Filter by time window, status, or pipeline template. Drill into any run to see errors and copy logs.
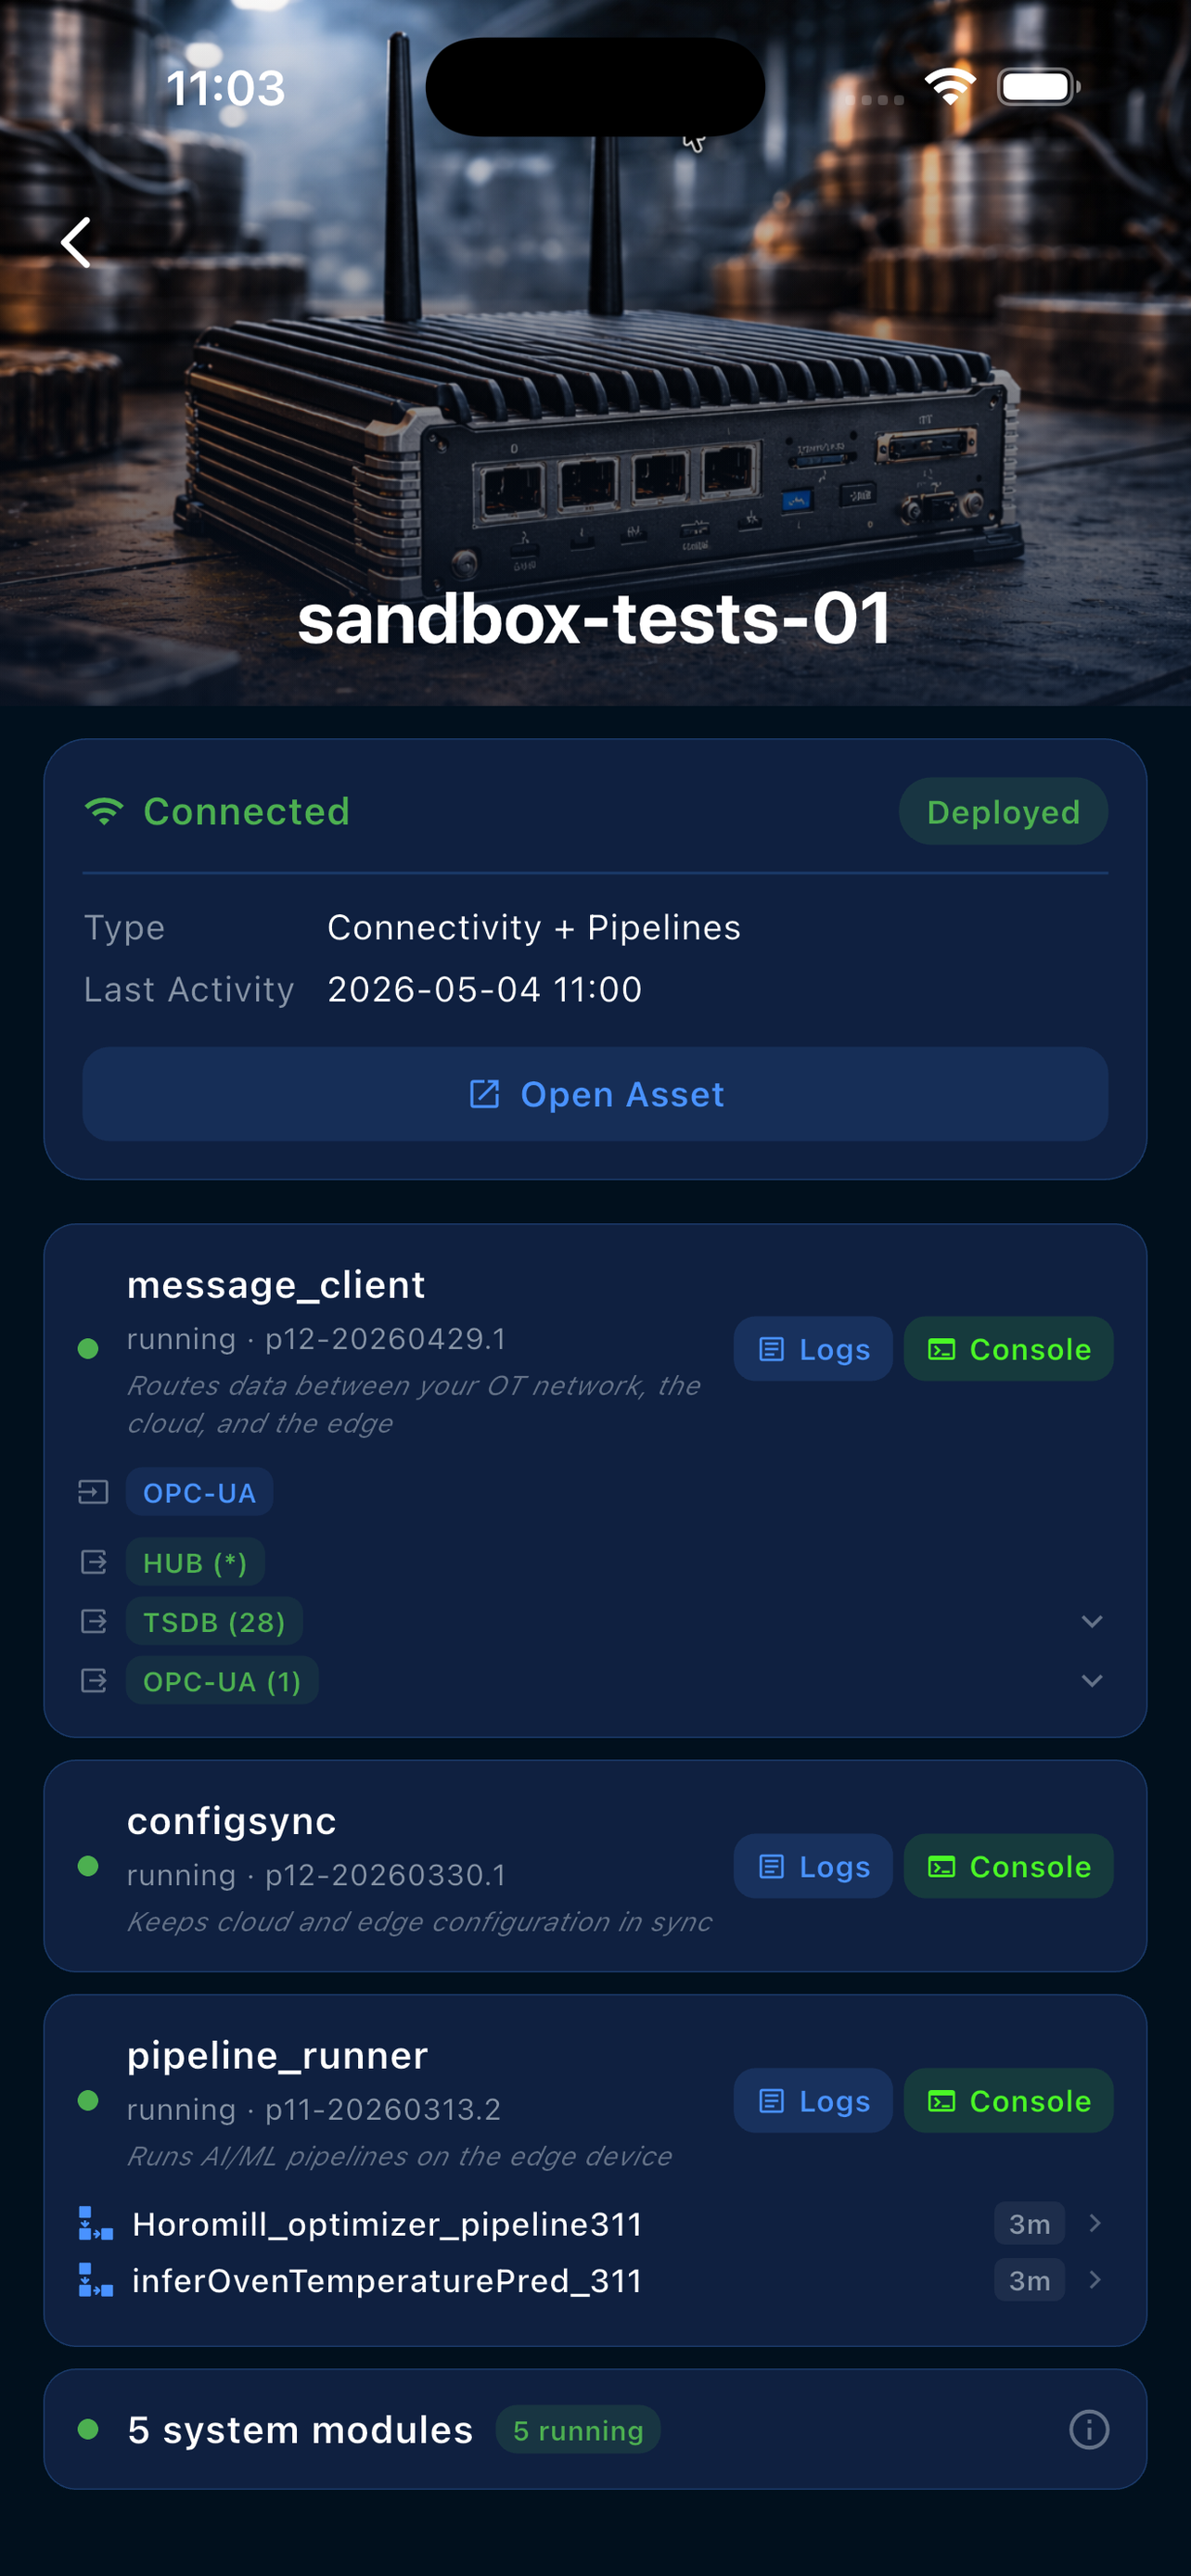
🛰️ Edge devices — Inspect your edge gateways: connection state, deployed modules, message clients, writers, triggers, and live logs.
⚙️ Multi-tenant — One install, any tenant. Each Wizata customer has their own deployment at {prefix}.onwizata.com, with isolated Azure AD authentication.
See it in action
Get started in 60 seconds
- Download — install Wizata Mobile from your store (badges above).
- Enter your tenant prefix — for example, if your Wizata environment is
acme.onwizata.com, typeacme. The app fetches your tenant's authentication configuration automatically. - Sign in with Azure AD — uses the native Microsoft sign-in sheet (MSAL). Single sign-on works if your device is already enrolled.
- You're in — your assets, dashboards, alerts, and edge fleet are ready.
What about security? Tokens stay in the device's secure keychain. Each tenant's data is isolated by Azure AD scope — even with multiple Wizata accounts, you'll never see another tenant's data. Push notifications include a tenant prefix check; cross-tenant notifications are dropped silently.
Push notifications
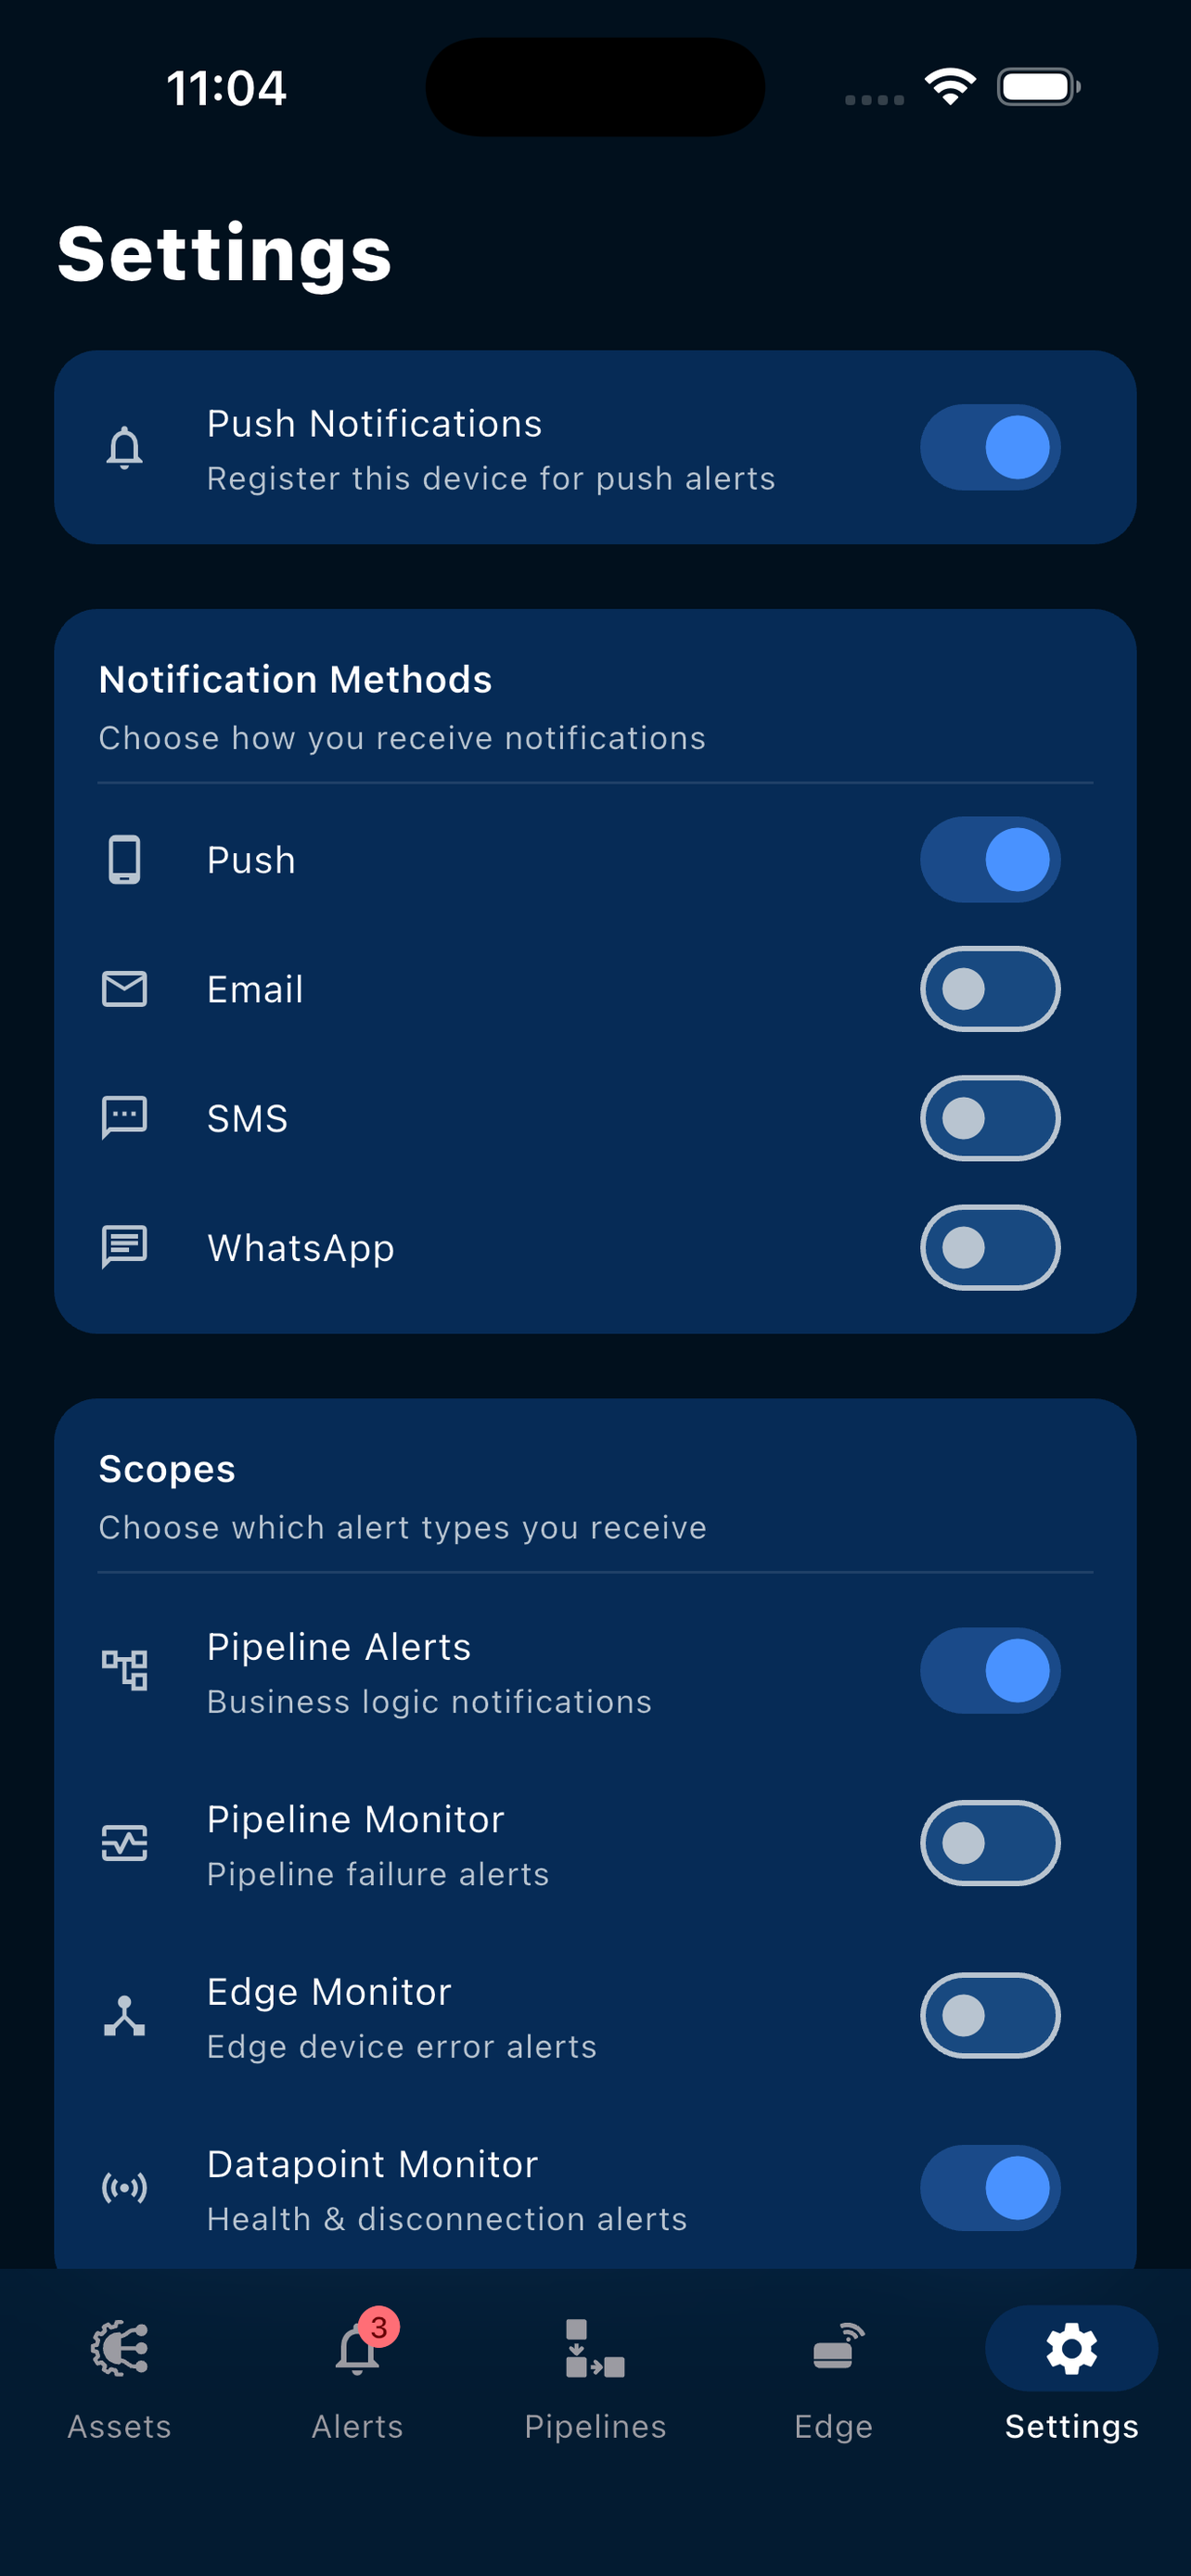
When you sign in, the app registers for push notifications with your tenant's backend. You can fine-tune which categories you receive in Settings → Notifications:
- Pipeline alerts — business logic notifications from pipelines
- Pipeline monitor — technical failures and aborts
- Edge monitor — gateway connectivity and module errors
- Datapoint monitor — out-of-range values, frequency drops, sensor disconnections
Each category can be toggled independently. Disable them all if you want a silent observer mode — the active alerts feed still works inside the app.
Updated 5 months ago